
Figure 6. Domain A interferes with an interaction of STIM1 with PDE8B and increases NFAT translocation.
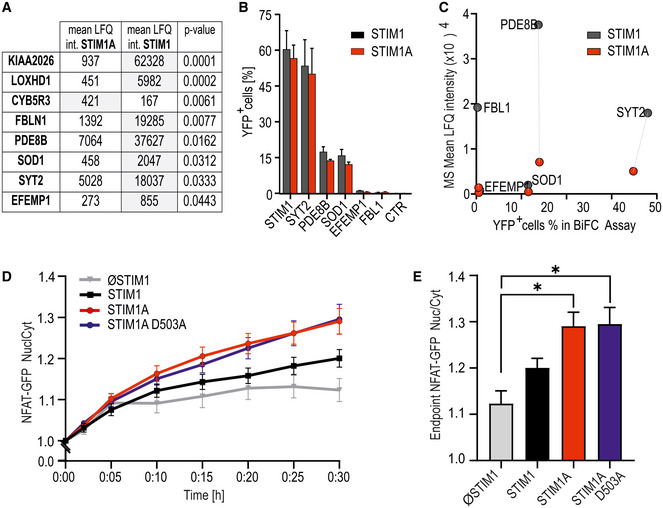
- Mean LFQ intensities of interaction candidates of three replicates each with pull‐down experiments of HA‐tagged STIM1A‐mCherry and STIM1‐mCherry after expression and TG activation in HEKS1/S2−/− cells. Eluates were analyzed via mass spectrometry, and only hits with significant differential scores (P < 0.05, Student’s t‐test) are shown.
- Hits from (A) tested for interaction with commercially available constructs quantified with bimolecular fluorescence complementation (BiFC) via flow cytometry. HEKS1/S2−/− were transfected with STIM1‐YFPC (black) or STIM1A‐YFPC (red) in combination with POI‐YFPN and screened for YFP+ cells via FACS; results (mean ± SD) were obtained from three transfections each with 10,000 sorted cells.
- Correlation of the mean LFQ intensities from (A) and YFP+ cells from BiFC assay from (B). Dotted lines show differences in interaction of the POIs with STIM1 in comparison with STIM1A.
- Ratio of nuclear NFAT‐GFP vs. cytosolic GFP intensity normalized to t = 0 (mean ± s.e.m.) after transfection of SH‐SY5Y S1−/− cells with STIM (n = 42), STIM1A (n = 82), STIM1A_D503A (n = 49), or vector‐only (ØSTIM, n = 15) IRES‐mCherry and induction of SOCE after stimulation with 1 µM TG. Data (total n as indicated) were obtained from at least three independent transfections.
- Normalized endpoint ratios at 30 min (mean ± s.e.m.) from numbers indicated in (D). *P < 0.05, Kruskal–Wallis ANOVA with Dunn’s multiple comparisons test.