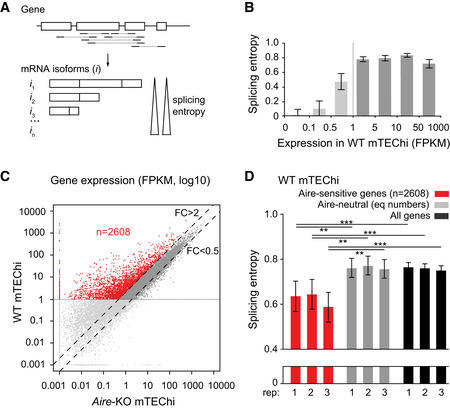
Schematic representation of a hypothetical gene with mapped paired‐end sequencing reads identifying transcript isoforms. The isoform diversity of this gene is evaluated by calculation of its splicing entropy.
Median splicing entropy of genes binned according to their expression levels. FPKM of 1 corresponds to the threshold over which the transcript isoform diversity can be accurately characterized in our RNA‐seq dataset. (three mTEChi biological replicates [combined]; error bars show the 95% confidence interval of the medians).
Identification of Aire‐sensitive genes upregulated by Aire in WT versus Aire‐KO mTEChi (FC > 2) and matching the threshold of 1 FPKM in WT mTEChi (red dots, n = 2,608). Aire‐neutral genes (0.5 < FC < 2) with expression levels over 1 FPKM in WT mTEChi are represented by dark gray dots between the dashed lines. (n = 3 WT and three Aire‐KO mTEChi biological replicates).
Median splicing entropy of Aire‐sensitive genes, Aire‐neutral genes (equal numbers), and all genes in each of the three mTEChi biological replicates (rep). Error bars show the 95% confidence interval of the medians. **P < 10−3, ***P < 10−4 (Wilcoxon test, n = 2,608, performed in each of the three biological replicates).