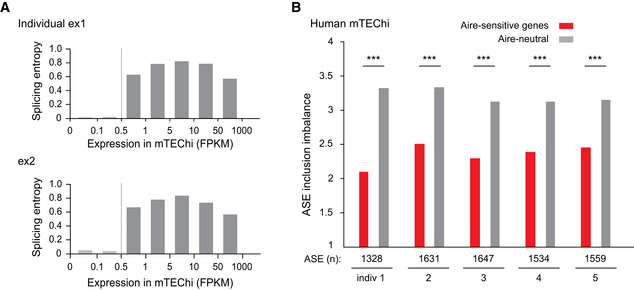
Figure EV1. Low levels of ASE inclusion imbalance for Aire‐sensitive genes in human mTEChi.

- Median splicing entropy of genes binned according to their expression values. FPKM of 0.5 corresponds to the threshold over which the transcript isoform diversity can be accurately characterized in our RNA‐seq dataset. Example of two individuals is shown.
- Levels of ASE inclusion imbalance for Aire‐sensitive and neutral genes in mTEChi of five different individuals, *** P < 10−4 (chi‐squared test).
