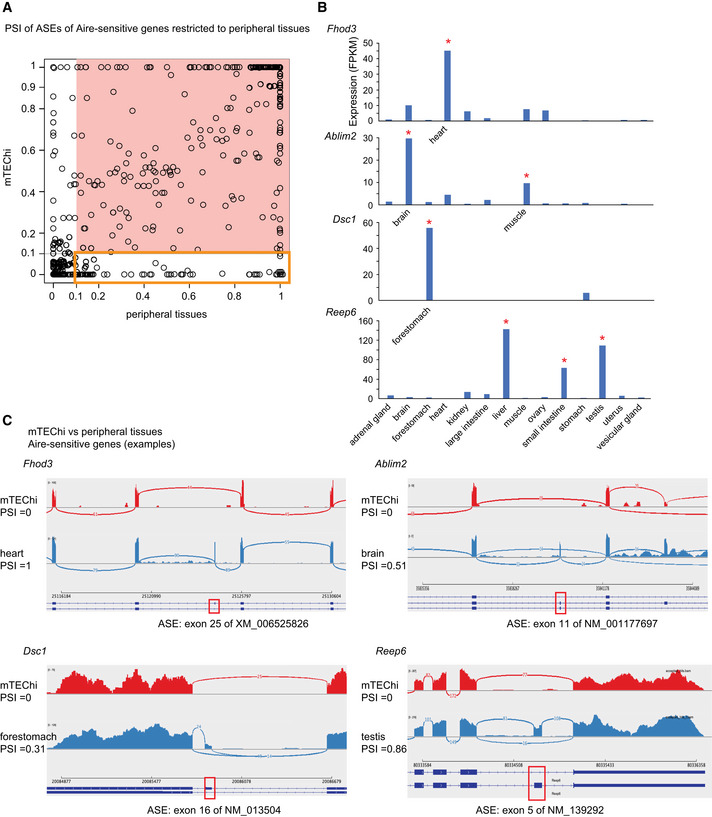
Figure EV2. PSI values of ASEs of Aire‐sensitive genes in mTEChi and in their tissues of expression.

- Each ASE is represented by a circle. ASEs excluded in mTEChi or in the periphery (PSI < 0.1) are shown on a white background, otherwise on a salmon‐colored background. The ASEs present in the periphery (PSI > 0.1) and excluded in mTEChi (PSI < 0.1) are framed by an orange square.
- Level of expression of Fhod3, Ablim2, Dsc1, and Reep6 (taken as examples of Aire‐sensitive genes with a specific or selective peripheral expression) from RNA‐seq data of mTEChi and 14 mouse tissues. Asterisks indicate the tissue(s) of specific/selective expression: Fhod3 is specific to the heart, Dsc1 to the forestomach; Ablim2 is selective to the brain and muscle, Reep6 to the liver, small intestine, and testis.
- Shashimi plots of the above genes show ASE exclusion (PSI < 0.1) in mTEChi (red) and some level of inclusion (PSI > 0.1) in the tissues of expression (blue). Arcs representing splice junctions connect exons. Red boxes indicate alternative spliced exons present or absent in the transcript isoforms of Fhod3, Ablim2, Dsc1, and Reep6.
