
Figure EV3. Comparison of Raver2 expression levels across TECs and epithelial cells from a variety of peripheral tissues.
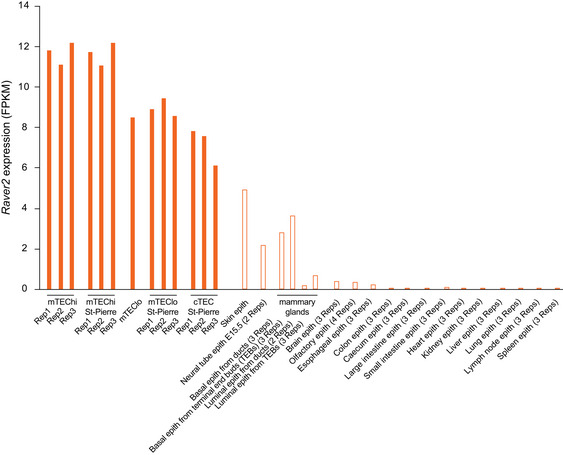
Closed bars are for TECs (mTEChi, mTEClo, and cTECs) including our dataset and St‐Pierre dataset for replication. Open bars correspond to Raver2 expression calculated by re‐analysis of public datasets of epithelial cells isolated from peripheral tissues.