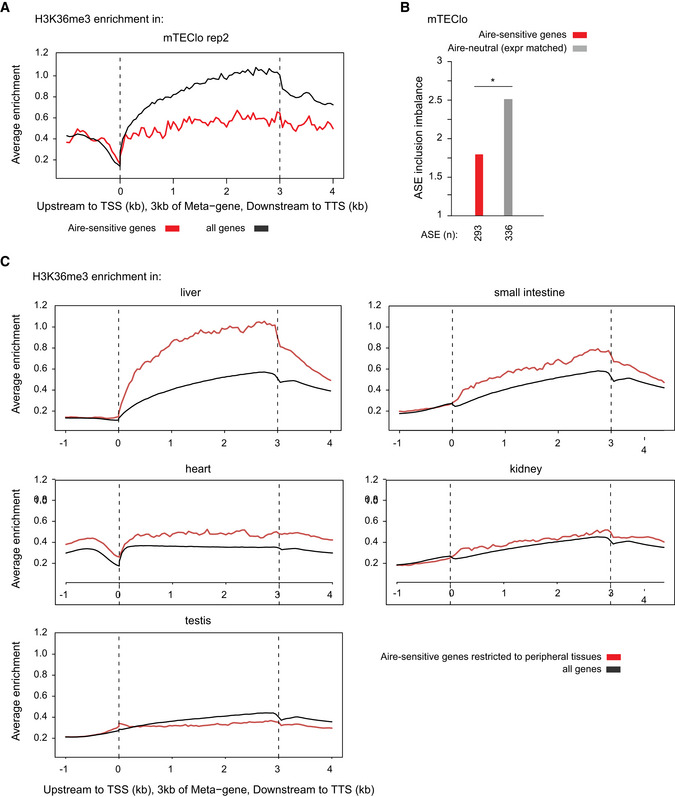
Figure EV5. Reduced H3K36me3 deposition at Aire‐sensitive genes in mTEClo in comparison to their tissues of expression.

- Metagene profiles of the average normalized enrichment of H3K36me3 for Aire‐sensitive genes (red) in mTEClo; all genes are shown in (black).
- Levels of ASE inclusion imbalance for Aire‐sensitive genes and neutral genes (expression matched), *P < 0.05 (chi‐squared test performed in one mTEClo dataset).
- Metagene profiles of the average normalized enrichment of H3K36me3 for Aire‐sensitive genes (red) in their tissues of expression; all genes are shown in (black).
