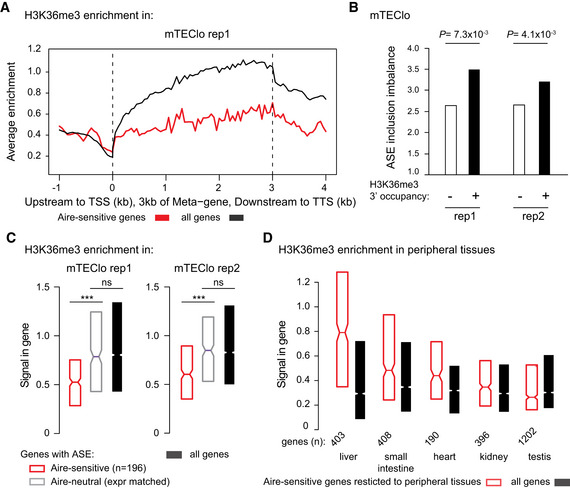
Figure 6. Aire‐sensitive genes show low levels of H3K36me3 correlated with low levels of ASE inclusion imbalance in mTEClo.

- Metagene profiles of the average normalized enrichment of H3K36me3 for Aire‐sensitive genes (red) and all genes (black) in mTEClo.
- Levels of ASE inclusion imbalance for genes with and without H3K36me3 in the last third of their gene bodies, in each biological replicate (rep1 and 2). The statistical significance is assessed by a chi‐squared test performed in each of the two replicates.
- Median enrichment of H3K36me3 for Aire‐sensitive genes and neutral genes (expression matched), as well as all genes in each biological replicate. *** P < 10−13 (Wilcoxon test).
- Median enrichment of H3K36me3 for Aire‐sensitive genes in their tissues of expression and for all genes.
Data information: In (C) and (D), notches represent the 95% confidence interval of the medians, and the limits of the upper and lower boxes the 75th and 25th percentile of H3K36me3 enrichment, respectively.
