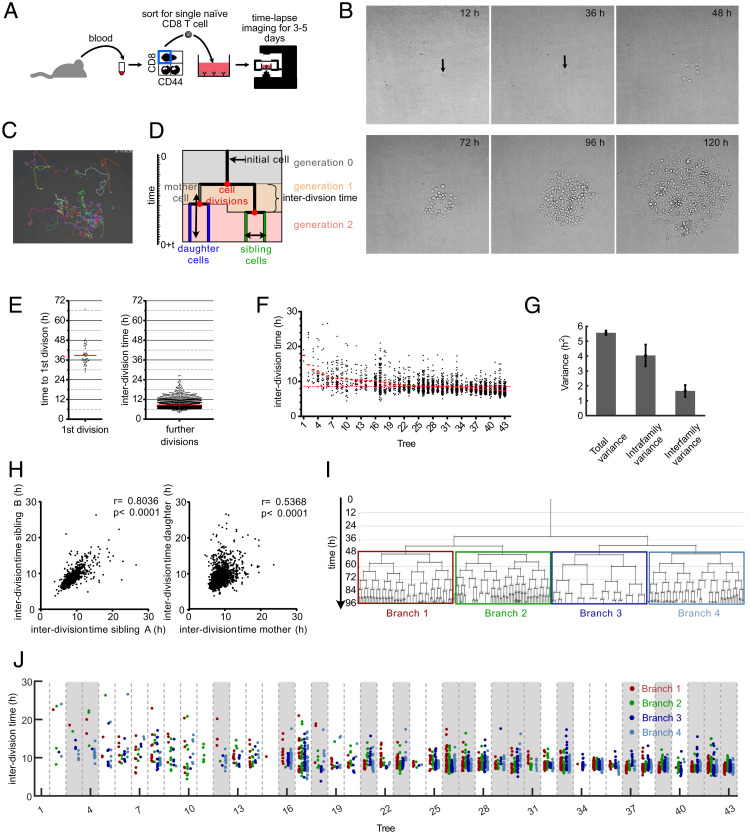
Fig. 1.
Continuous in vitro imaging reveals that distinct cell cycle speeds emerge within the same T cell family. (A) Blood was taken from an OT-I mouse and sorted for naive CD8+, CD44low cells. A single naive OT-I cell was sorted into a well that was coated with anti-CD3 and anti-CD28 in the presence of 25 U/mL IL-2. The cell culture plate was transferred to a live-cell imaging microscope and imaged for the next 3 to 5 d. (B) Pictures, taken at different time points from the same single cell–derived progeny. The length of each micrograph edge is 250 μm. (C) Snapshot of a single cell–derived progeny at 3 d, 17 h, and 45 min after start of acquisition. Colored lines represent migration pattern of individual cells. (D) Definitions of family tree–associated data; y axis, time; generation, the number of cell divisions that have occurred from the naive T cell until the respective cell was created by division of its respective mother cell; mother and daughter cells, the two cells that originate from the same cell division are daughter cells in respect of the original cell that divided (mother cell); sibling cells, cells that have the same mother cell; interdivision time, time between the creation of an individual cell due to the division of its mother cell into two daughter cells and the end of the respective cell due to its own division into two new daughter cells. (E) Time for first and subsequent divisions. Single naive (CD44low) CD8+ T cells were sorted into separate wells of an anti-CD3/CD28–coated 384-well plate and imaged for 5 d in a live-cell imaging microscope. The fate of each cell was tracked, and the interdivision time for the first division and all subsequent divisions was determined for 43 single-cell–derived progenies (in total, 43 cells for first division and 2,710 cells for subsequent cell divisions). Red lines indicate the means. (F) Intra- and interclonal variability of interdivision times. The interdivision times from E (first division excluded) are arranged according to their mean interdivision time; red bars, mean interdivision time within family tree; red dotted line, mean for all cells. Of note, very little cell death was observed in these experiments. Thus, differences in the number of displayed data points per family are mainly due to differences in the average division speed and the efficiency of continuous tracking (Materials and Methods). (G) Total variance of interdivision times from further divisions in E as well as the contribution of intrafamily and interfamily variances are shown. Intrafamily variance is calculated as the weighted mean of the variances of interdivision times within all different families. Interfamily variance is calculated as the weighted variance of the mean interdivision times of different families (SI Appendix, Supplementary Methods); total variance, 5.57 ± 0.15; intrafamily variance, 4.045 ± 0.73; interfamily variance, 1.66 ± 0.39. The distribution of intrafamily variance is significantly larger than that of interfamily variance (P < 1 × 10⁻³). (H) Interdivision times from E were plotted against the interdivision times of their sibling cell (Left, 1,201 pairs) or their direct daughter cells (Right, 2,630 pairs). The correlation coefficients (r) and the P values for Spearman correlations are indicated. (I) A representative family tree was divided into four branches starting from generation 2; loose ends, no further tracking possible for the respective cell. (J) Interdivision time of cells in the four branches starting from the second generation (as depicted in I) are color coded for all trees in F. In 18 of 43 trees (∼42%; trees highlighted in gray), interdivision times differed significantly between the four branches. For every tree, a P value was calculated based on one-way ANOVA. We then estimated positive false discovery rates (pFDR) for multiple hypothesis testing based on these P values and used a cutoff of pFDR < 0.05 for significance.

