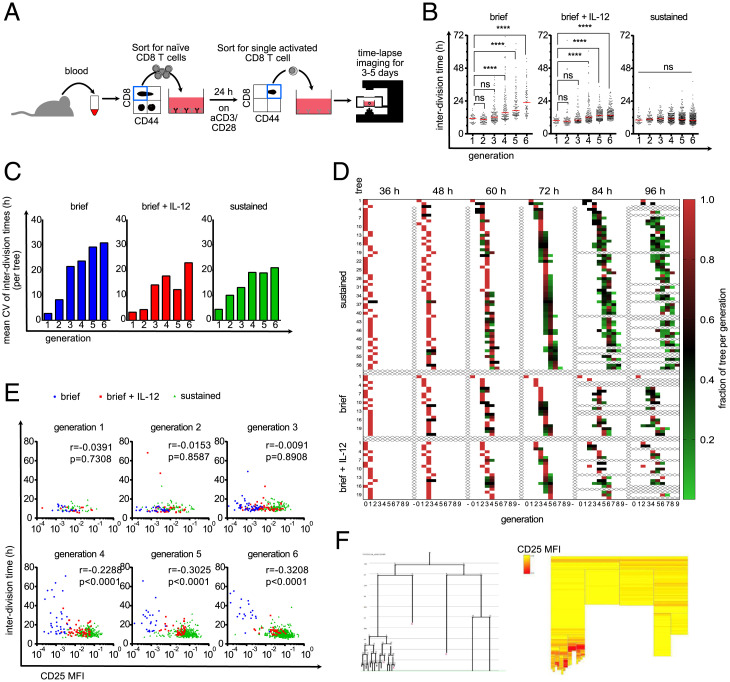
Fig. 3.
Diversification of division speed occurs after a homogenous burst phase and is preceded by differences in CD25 expression. (A) Live-cell imaging with brief TCR stimulation. Blood was taken from an OT-I mouse and sorted for naive CD8+ T cells. Ten thousand cells/well were activated for 24 h with plate-bound anti-CD3/CD28 and 25 U/mL IL-2. Cells were sorted again for activated (CD44high) cells, and a single cell was sorted in each well of a 384-well plate that was coated with ICAM-1 or anti-CD28 to enable attachment. The cells were imaged for 3 to 5 d. (B) Cells were stimulated as described in A. After the brief stimulation and segregation, 10 ng/mL IL-12 was added to the medium (Middle) or not (Left). Cells were stimulated continuously with anti-CD3/anti-CD28 as in Fig. 1 (Right). The interdivision times of all cells are plotted for the respective generations. Red lines indicate the median. Kruskal–Wallis test; ****P < 0.0001. (C) Data points from B were allocated to the different family trees, and the CVs of the interdivision times within the trees were calculated within each generation. The mean of these CVs is plotted as a bar graph, on average, 15.45 trees per bar (range of 4 to 27). (D) For all three conditions, it is shown how the individual cells within a tree are distributed over the generations at different time points. The fraction of tree per generation is calculated by dividing the number of cells in a specific generation at the given time point by the maximum number of cells potentially present in the respective generation (number of cells in generation X/2generation X). For example, for a potential tree that consists after 48 h of one cell in generation 2 and six cells in generation 3, the respective fractions of tree per generation are for generation 2, 1/22 = 0.25, and for generation 3, 6/23 = 0.75. For incompletely tracked trees (e.g., when cells died or the identity of cells is unclear), the fractions of tree per generation is corrected so that the sum of all fractions of tree per generation sum up to 1.0 (corrected fraction of tree per generation = fraction of tree per generation/sum of all fractions of tree per generation at the same time point). Each square represents the cells of a tree that are in the respective generation at the given time point. The redder the box is, the higher is the fraction of the tree in the respective generation. Thus, red boxes indicate synchronized cell divisions, whereas green boxes indicate desynchronization. Samples from the continuous stimulation setting are depicted at the Top. Below that are the short stimulation samples. The short stimulation + IL-12 samples are depicted at the Bottom. (E) As in A, but anti-CD25–APC was added to the culture. The interdivision times of all cells from all investigated trees were separated according to their generation, and their interdivision times were plotted against their CD25 expression; blue, brief stimulation without IL-12; red, brief stimulation with IL-12; green, continuous stimulation. Spearman r and P values are as indicated; generation 1, 80 cells; generation 2, 138 cells; generation 3, 232 cells; generation 4, 313 cells; generation 5, 422 cells; generation 6, 583 cells; MFI, mean fluorescence intensity. (F) Exemplary tree (brief stimulation + IL-12) shown as family tree (Left, loose ends with red X indicate that the cell died) and heat tree (Right). Each box represents a cell as in the family tree; yellow, low CD25 expression; red, high CD25 expression; blank, no CD25 quantification possible.

