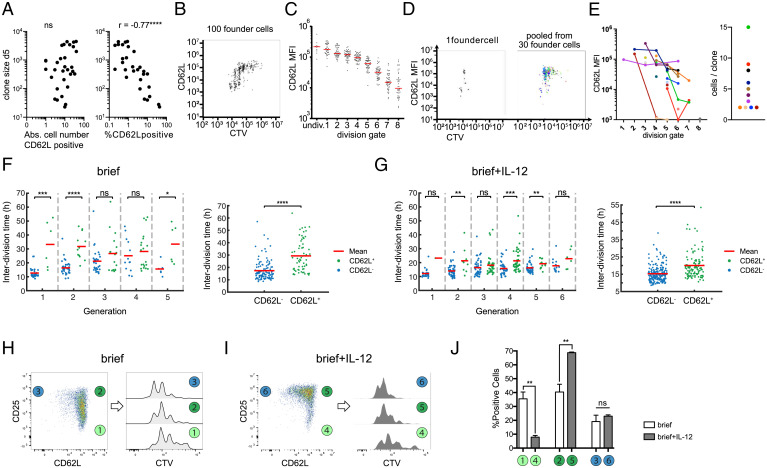
Fig. 4.
Adoption of slower division speed coincides with expression of CMP marker CD62L. (A) Cell numbers of single-cell–derived progenies are plotted against the absolute number of CD62L-expressing cells (Left) or the percentage of CD62L-expressing cells (Right) (determined by flow cytometry) within the respective T cell family (continuous TCR stimulation). Spearman correlation coefficient, r = −0.7569; P < 0.0001, n = 31 (cells with %CD62L = 0% excluded from analysis); Abs, absolute. (B) Representative Cell Trace Violet plot of the offspring of 100 OT-I cells that had been stained with Cell Trace Violet and activated for 24 h. After a further 3 d of cell culture, the cells were stained for CD62L and analyzed by flow cytometry. (C) On the basis of the vertical lines in the Cell Trace Violet plot in B, the number of cell divisions for each cell in the plot can be estimated. The mean CD62L expression within each division peak is shown for all cells of the 100 cell-derived progenies. (D) Representative Cell Trace Violet plot as in B but from a single progenitor cell (Left). Overlay of 30 single-cell Cell Trace Violet plots (Right). Each color represents a different single-cell–derived progeny. (E) CD62L expression in division peaks as in C but from single-cell–derived progenies. Single-cell–derived progenies distributed across more than one division peak are connected with a line (Left). Corresponding scatter plot showing the number of recovered cells for each single-cell–derived progeny distributed across more than one division peak (Right). Single-cell–derived progenies that were present in only one division peak are not displayed in the Right plot (i.e., 13 progenies containing 1 cell, 1 progeny with 2 cells, 2 progenies with 3 cells, and 1 progeny with 7 cells). (F) Interdivision times in different generations (Left) and from all generations together (Right) in the “brief” stimulation condition. The two-sided Wilcoxon rank sum test is used to determine if the interdivision times of CD62L+ (green) and CD62L− (blue) cells are significantly different; ns, P > 0.05; *P ≤ 0.05; **P ≤ 0.01; ***P ≤ 0.001; ****P ≤ 0.0001. (G) Same as F for the “brief + IL-12” stimulation condition. (H) Representative pseudocolor plot showing expression of CD25 and CD62L for population-derived responses in the “brief” stimulation condition and definition of three subpopulations based on their CD25/CD62L profile (Left) and corresponding overlaid histograms showing intracellular dye dilution profiles for each of these three subpopulations (Right). (I) Same as H for the “brief + IL-12” stimulation condition. (J) Corresponding bar graph depicting the percentage of cells in each subpopulation defined in H and I under both stimulation conditions. The unpaired t test is used to determine statistical significance between both stimulation conditions; ns, P > 0.05; **P ≤ 0.01.

