Fig. 3.
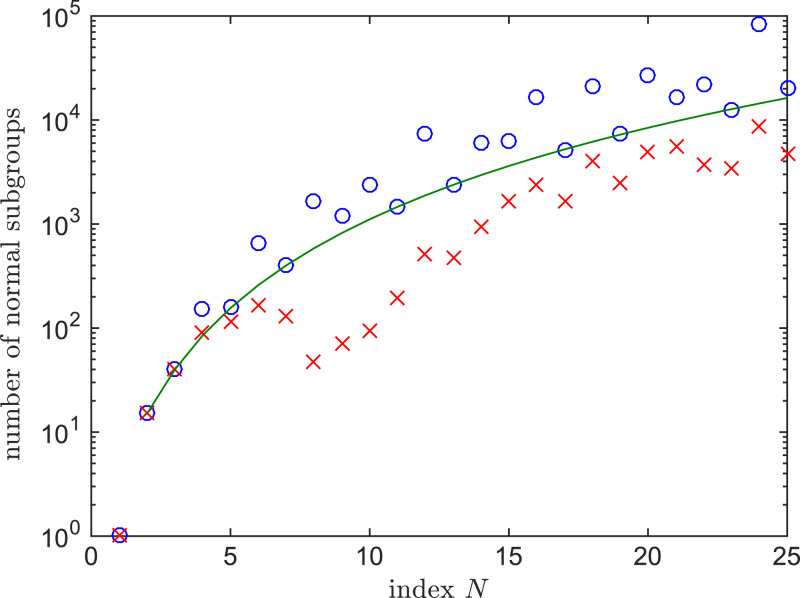
Number of distinct normal subgroups in Γ as a function of index N, as computed by LINS. Blue circles indicate all normal subgroups, the green line indicates plot of Eq. 13, and red crosses indicate normal subgroups giving rise to connected PBC clusters for which words of length 3 and longer are excluded from the transversal T.

