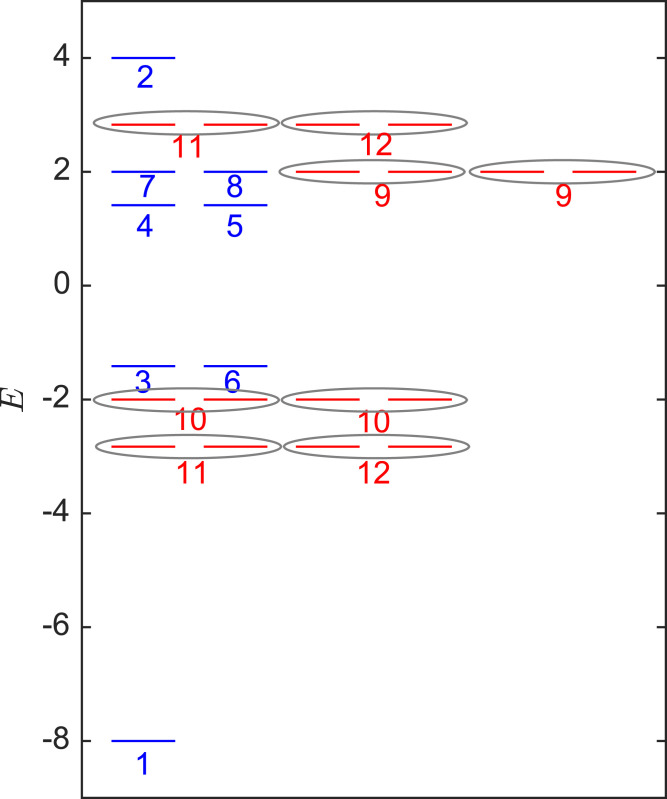
Fig. 7.
Energy spectrum of the hopping Hamiltonian on the PBC cluster considered in Irrep Decomposition of the Finite-Size Spectrum: An Explicit Example. Blue indicates levels corresponding to abelian states; red indicates levels corresponding to nonabelian states. Numbers correspond to the irrep label λ, and gray ellipses denote eigenstates belonging to a (2D) nonabelian irrep.

