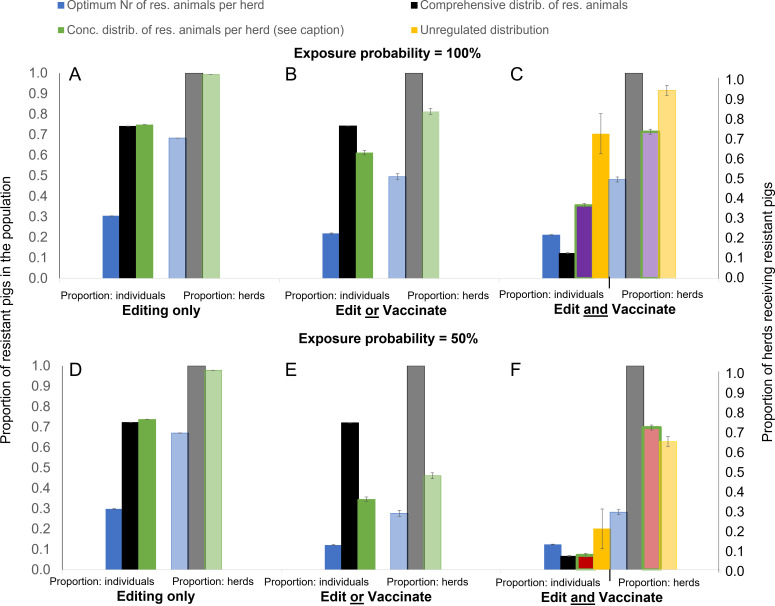
Fig. 2.
Minimum required proportion of genetically resistant animals (solid bars) and corresponding herds adopting gene editing (transparent bars) for achieving disease elimination through gene editing alone or with vaccination combined, depending on how edited animals are distributed across the herds. Results are shown for average R0 value of 1.5 and exposure probability of either 100% (A–C) and 50% (D–F) and vaccine effectiveness of 70%. Different colors refer to different distribution scenarios (see Table 1) with blue = optimum, black = comprehensive, green = concentrated and yellow = unregulated. The proportion of edited animals in the concentrated scenarios is chosen at the smallest possible proportion for elimination under each scenario, resulting in a Pe of 0.75 for scenarios A, B, D, and E (green bars), a Pe of 0.5 for scenario C (green bars, purple fill), and a Pe of 0.1 for scenario F (green bars, red fill). For further explanation of editing and vaccination strategies and the different distribution of edited individuals across herds see the main text.

