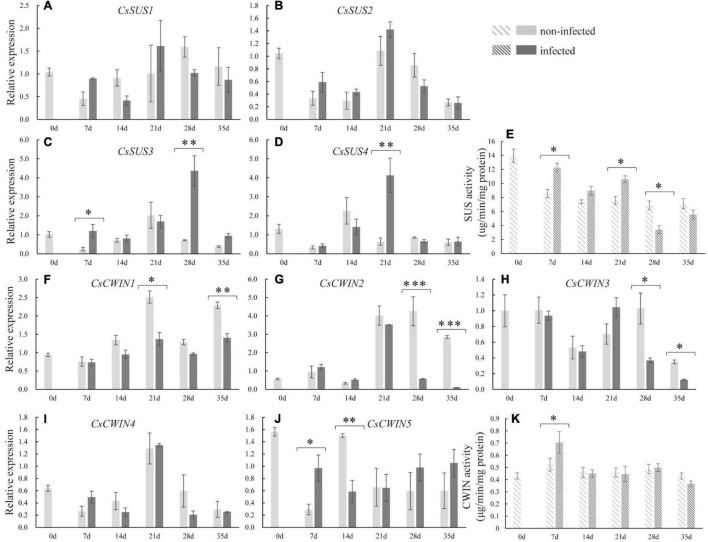
FIGURE 5.
Expression levels of sucrose synthase genes (CsSUS1–4) (A–D), cell wall invertase genes (CsCWIN1–5) (F–J), and the enzyme activity analysis of CsSUS (E) and CWIN (K) in infected and non-infected cucumber roots by M. incognita. Error bars represent ± SE (n = 5). Student’s t-test is analyzed between infected and non-infected roots, *P < 0.05; **P < 0.01; ***P < 0.001.

