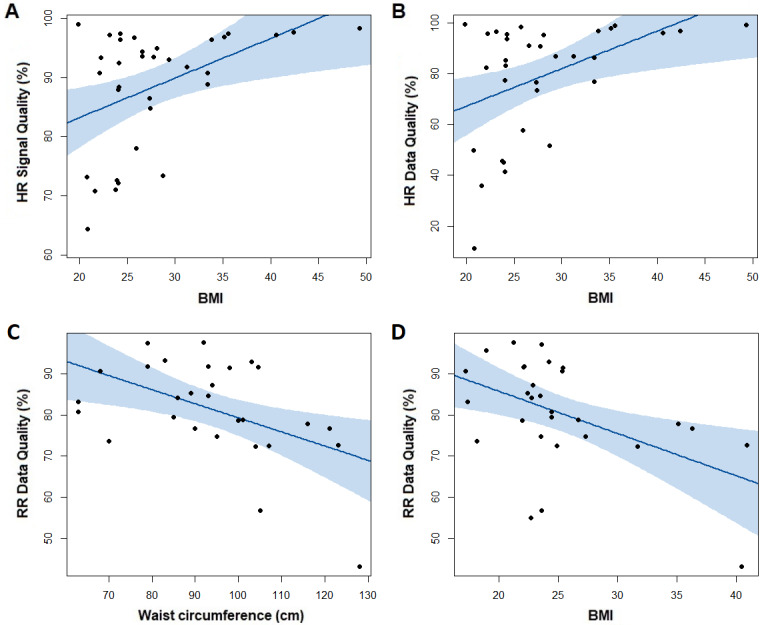
Figure 3.

Associations within the Stable group (n=49) between (A) HR signal quality and BMI and (B) HR data quality and BMI, and associations within the AECOPD group (n=35) between (C) RR data quality and waist circumference and (D) RR data quality and BMI. The shaded area indicates 95% CI and P values and correlations calculated using Spearman ρ. AECOPD: acute exacerbation of chronic obstructive pulmonary disease; HR: heart rate; RR: respiratory rate.
