Fig. 3.
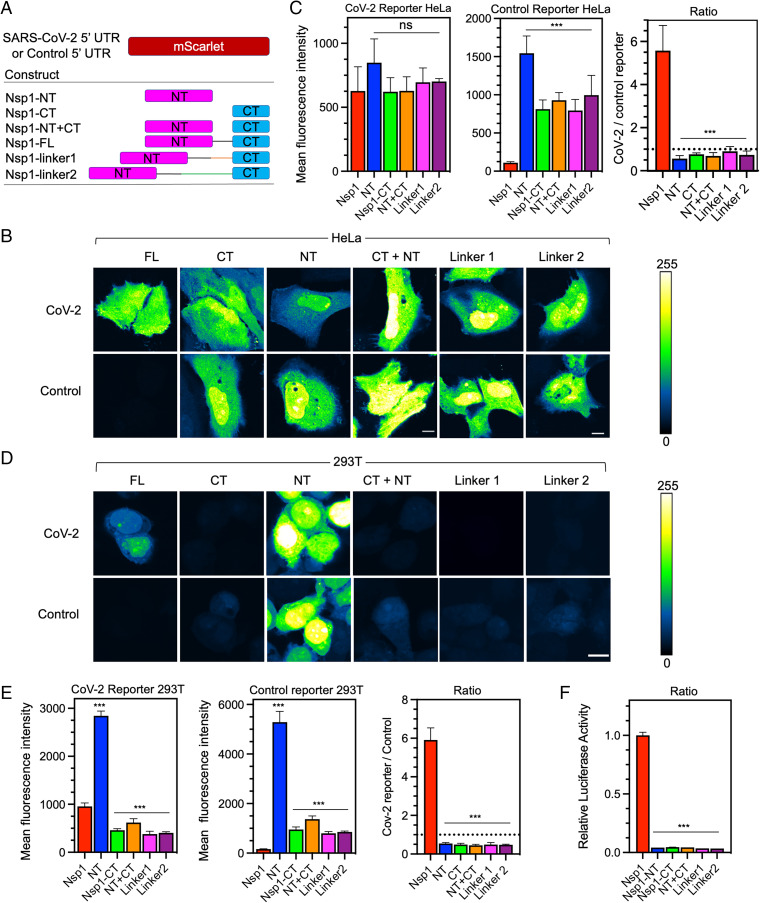
Nsp1 NT and CT cooperate to drive viral translation selectivity. (A) Schematic of coexpression system with CoV-2 or control reporter along with various fragments of Nsp1 (FL, NT, CT, NT+CT) or extended linker mutants (linker1, linker2). (B) mScarlet fluorescence intensity in HeLa cells cotransfected with either the CoV-2 (Upper) or control reporter (Lower) along with various mutants of Nsp1. Intensity values are fals- colored according to a scale (Right). (Scale bar, 10 μ.) (C) Quantification of fluorescent intensity in B of CoV-2 (Left) or control reporters (Center) and the ratio of CoV-2/Control (Right) with different Nsp1 mutants. (Dashed line marks ratio of 1). (D) mScarlet fluorescence intensity in 293T cells as in B. (E) Quantification of D. (F) Relative luciferase activity in 293T cells assay cotransfected with CoV-2 firefly luciferase and control Renilla luciferase reporters along with various Nsp1 mutants. The ratio of firefly/Renilla luciferase was normalized and plotted in three replicates. Error bars represent SD. (Scale bars, 10 μm.) *P < 0.05, **P < 0.01, and ***P < 0.001, Student t test.

