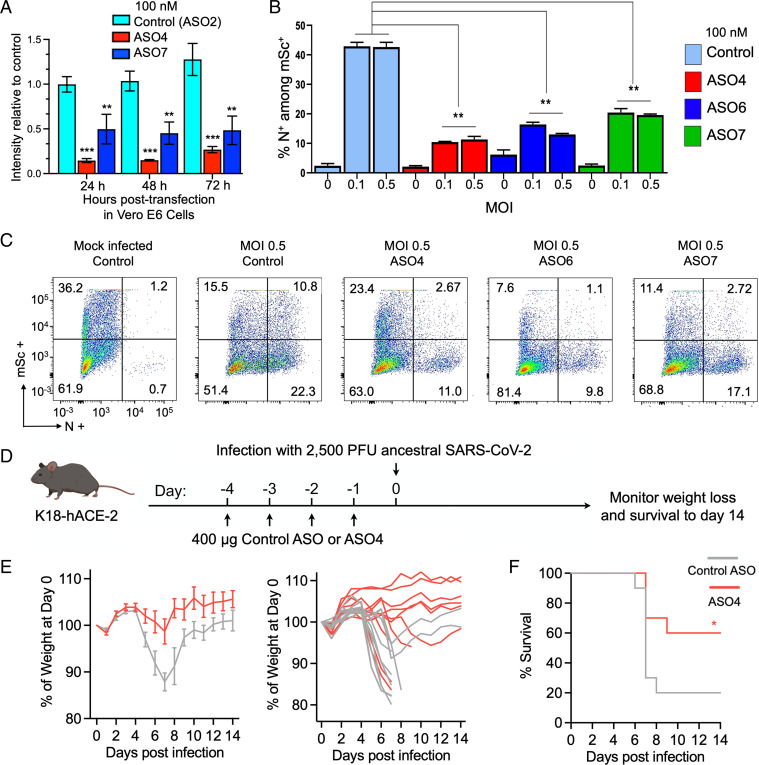
Fig. 5.
ASOs targeting SL1 produce stable loss of function to inhibit SARS-CoV-2 replication in vitro and ASO4 provides significant protection against SARS-CoV-2–induced lethality in K18-hACE2 mice. (A) Various ASOs along with CoV-2 reporter and MBP-Nsp1 were transiently transfected into Vero E6 cells and reporter intensity was measured daily over the course of 72 h, shown for each ASO (control, ASO4, and ASO7) at each time point. Since expression from transfected plasmids naturally changes over time, each datapoint was normalized to intensity of a parallel control where no ASO was included. (B) Percent of successfully transfected cells (marked by mScarlet [mSc] positivity) that were N+ by ASO treatment (color coded according to the legend on the right) at various MOIs. Error bars represent SD. (A and B) *P < 0.05, **P < 0.01, and ***P < 0.001, Student t test. (C) Nucleocapsid intensity plotted against mSc obtained by flow cytometry for each treatment (infected at MOI 0.5). Quadrants demarcate mSc+, N+ cells (top right quadrant), and the corresponding percentage of cells is listed in each corner. (D) Schematic for mouse infection experiment. K18-hACE-2 mice were treated with daily intranasally administered control ASO or ASO4 for 4 d following infection with 2,500 PFU of SARS-CoV-2 and monitored for weight loss and survival for 14 d. (E) Average percent weight loss over time for control ASO (gray) or ASO4 (red) after infection (Left) and individual weight loss trajectories (Right). (F) Survival curves over time for control ASO (gray) or ASO4 (red) after infection. n = 10 mice for each treatment.

