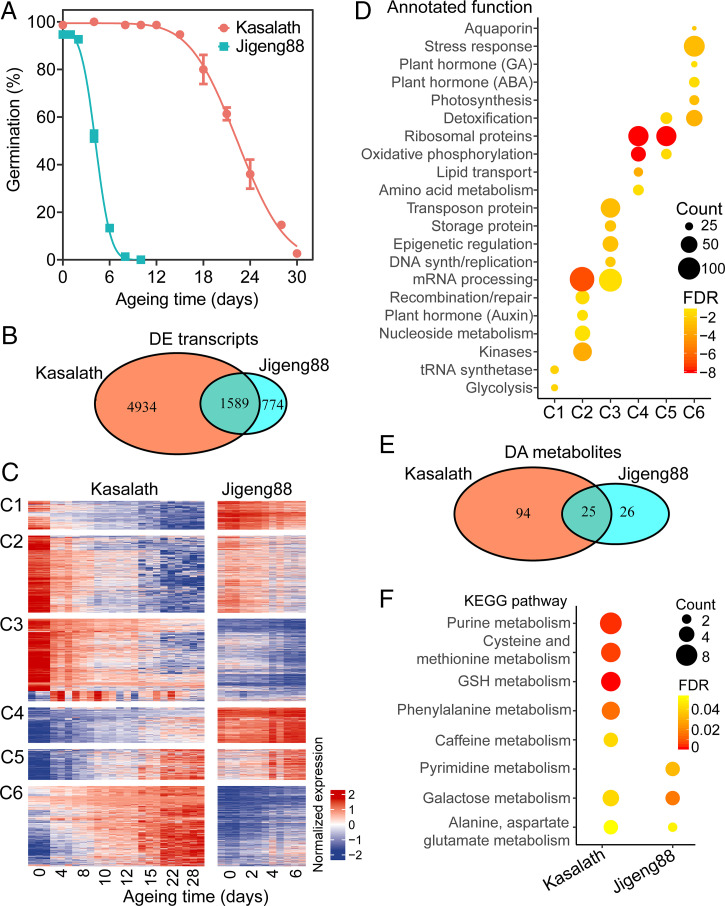
Fig. 1.
Global comparison of transcriptomic and metabolomic change during Kasalath and Jigeng88 seed aging. (A) The change in Kasalath and Jigeng88 seed germination during accelerated aging. The seeds were aged under 45 °C and 80% RH. The error bars indicate ± SE (n = 3). (B) A Venn diagram of the comparison of DE transcripts during Kasalath and Jigeng88 seed aging. (C) The expression profile of transcripts DE during Kasalath seed aging. The expression of transcripts DE during Kasalath seed aging was grouped into six clusters in contrast to their corresponding expression during Jigeng88 seed aging. At each aging time point, the data were shown in three biological replicates. (D) The enrichment of biological processes in different expression clusters. The biological processes were then manually annotated. P values were determined from the hypergeometric test with FDR calibration. (E) A Venn diagram of comparison of DA metabolites during Kasalath and Jigeng88 seed aging. (F) KEGG enrichment analysis of DA metabolites. KEGG pathways that were significantly enriched (FDR < 0.05) are shown.

