Fig. 2.
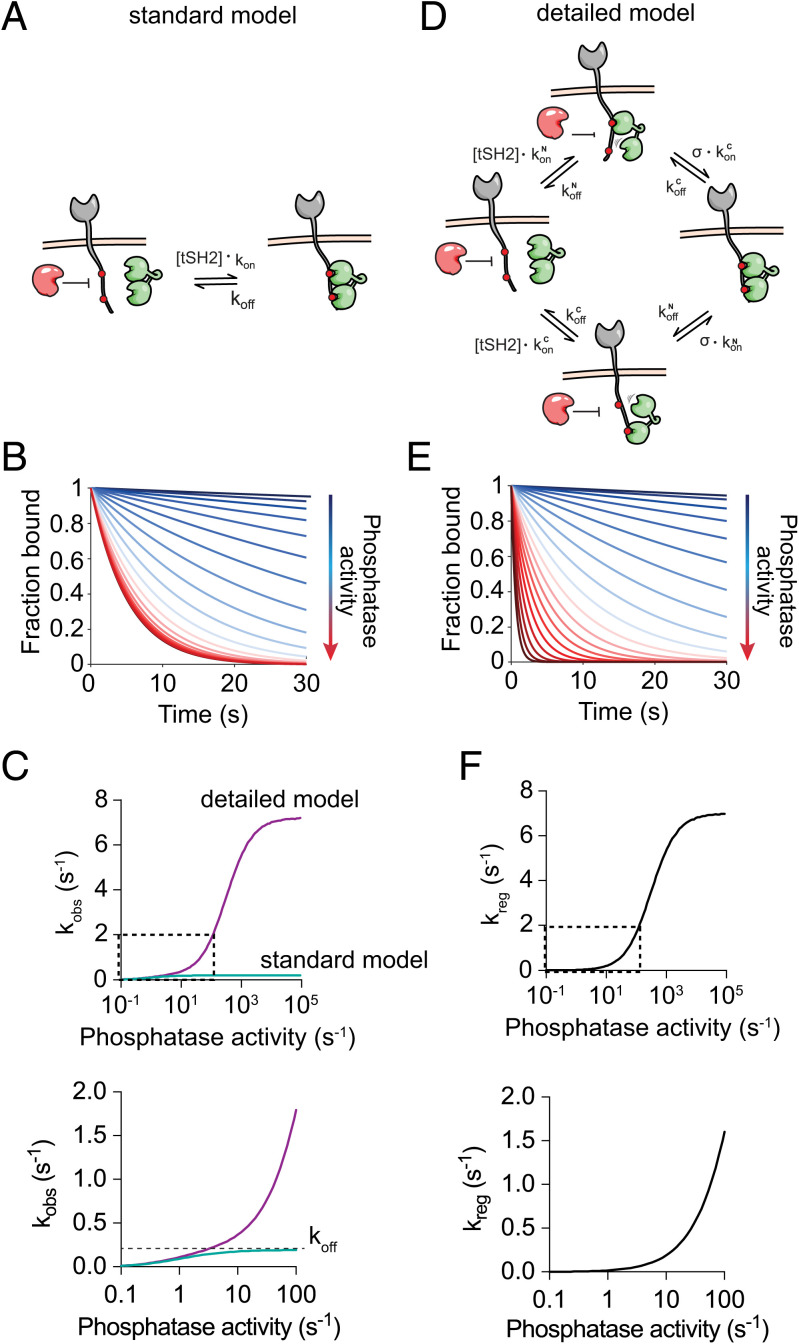
A detailed model of ZAP70 to ITAMs, which incorporates multiple internal states, predicts regulated unbinding by phosphatases. (A) A standard 1:1 binding model that assumes that phosphatases (red) can dephosphorylate exposed (nonbound) phosphotyrosines. (B) The amount of ZAP70 bound over time for increasing protein tyrosine phosphatase (PTP) activity for the model in A. (C) The observed unbinding rate over PTP activity determined by exponential fit to the standard (green) and detailed (purple) binding models. (D) The detailed binding model for ZAP70 reflecting dynamic internal states of the complex parameterized by an on-rate and an off-rate for each SH2 domain binding and each phosphotyrosine and by the local concentration of phosphotyrosine experienced by the unbound SH2 domain when ZAP70 is bound by the other SH2 domain (σ). In this model, phosphotyrosines are exposed even when ZAP70 is bound to the ITAM. (E) The amount of ZAP70 bound over time for increasing PTP activity for the model in D. (F) The regulated unbinding rate is calculated by the difference in observed off-rates between the detailed and standard binding models in C. The boxed section in Upper is shown enlarged in Lower.

