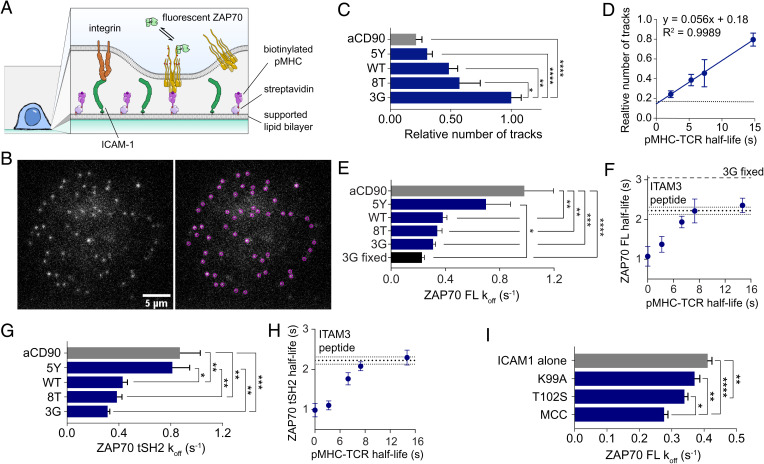
Fig. 5.
ZAP70 membrane half-life correlates with the TCR–pMHC half-life in T cells. (A) Diagram of the experimental system. (B) Example frame (Left) and identified particles (Right) of a live cell ZAP70-Halotag SPT experiment with 3G pMHC and ICAM1. (C) Number of labeled ZAP70s recruited to the interface between ILA Jurkats and pMHC-decorated supported lipid bilayer normalized to the highest-affinity pMHC (3G). (D) Number of ZAP70-Halotags over the TCR–pMHC half-life [measured at 25 C (68)], with the horizontal line indicating the anti-CD90 condition. (E) Fitted koff and (F) half-life calculated from koff over the TCR–pMHC half-life from the distribution of membrane binding times. (G and H) Repeat of experiments in E and F except with the truncated tSH2-GFP instead of the full-length ZAP70-Halotag. (I) The koff of full-length ZAP70-GFP recruited to the membrane at the interface of primary and TCR transgenic mouse CD4 T cells in live cell SPT experiments. All binding time distributions were fit with a sum of two exponentials with the slow rate displayed. Data are from at least eight cells per condition imaged in three separate experiments. Means ± SEMs are shown. *P < 0.05 (one-way ANOVA with Tukey’s posttest); **P < 0.01 (one-way ANOVA with Tukey’s posttest); ***P < 0.001 (one-way ANOVA with Tukey’s posttest); ****P < 0.0001 (one-way ANOVA with Tukey’s posttest). FL, full length; MCC, moth cytochrome c; WT, wild-type.

