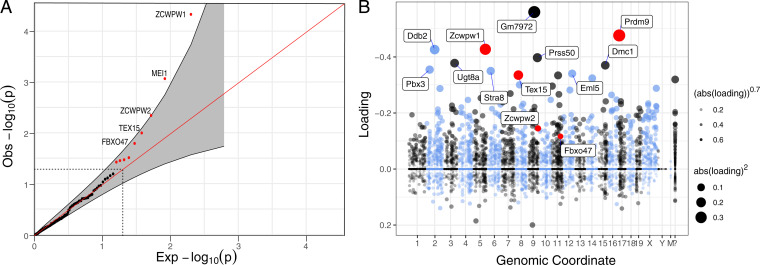
Fig. 2.
Phylogenetic tests and genes coexpressed with PRDM9 in single-cell mouse testes data. (A) Quantile-quantile plot of the P values obtained from the phylogenetic tests run on 139 genes that appeared to have been lost at least once in the 189 vertebrate species considered. Genes that are significant at the 5% level are shown in red (outside the dashed lines), and a pointwise 95% confidence interval is shown in gray. Genes with an FDR ≤ 50% are annotated. (B) Loadings for one of 46 components (component 5) inferred from single-cell–expression data in mouse testes (31), in which PRDM9 is most highly expressed. The dot sizes are proportional to the square of the absolute value of the loading. PRDM9 and the three genes identified in our phylogenetic tests with P < 0.05 are shown in red. Mouse genomic coordinates are displayed. Panel B was made from summary statistics provided by ref. 31, using SDAtools (https://github.com/marchinilab/SDAtools/).

