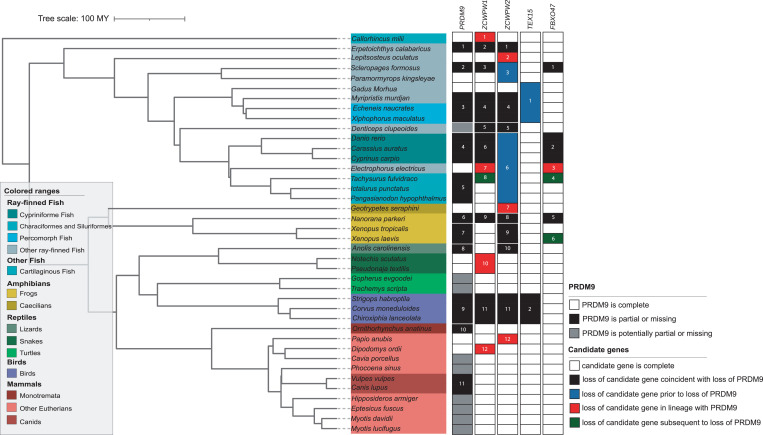
Fig. 3.
A summary of the phylogenetic distribution of PRDM9 and the four candidate genes across 189 species. Ortholog calls for candidate genes were based on a search of gene models within whole-genome sequences (Methods), and the phylogenetic test for coevolution with PRDM9 was rerun on these updated calls; updated P values for the phylogenetic test are shown in Table 1. Solid white and black rectangles indicate whether PRDM9 is present or absent, respectively, and gray rectangles lineages for which the status of PRDM9 is uncertain (Methods). For candidate genes, white rectangles are instances in which the gene is present and complete and solid black rectangles indicate when loss of candidate gene is coincident with that of PRDM9. Solid blue rectangles point to instances in which loss of candidate gene occurred prior to that of PRDM9 and green rectangles when it occurred subsequent to that of PRDM9. Red rectangles denote cases in which loss of the candidate gene occurred in lineages with a complete PRDM9. The full phylogenetic distribution of PRDM9 and candidate genes is in SI Appendix, Fig. S10.

