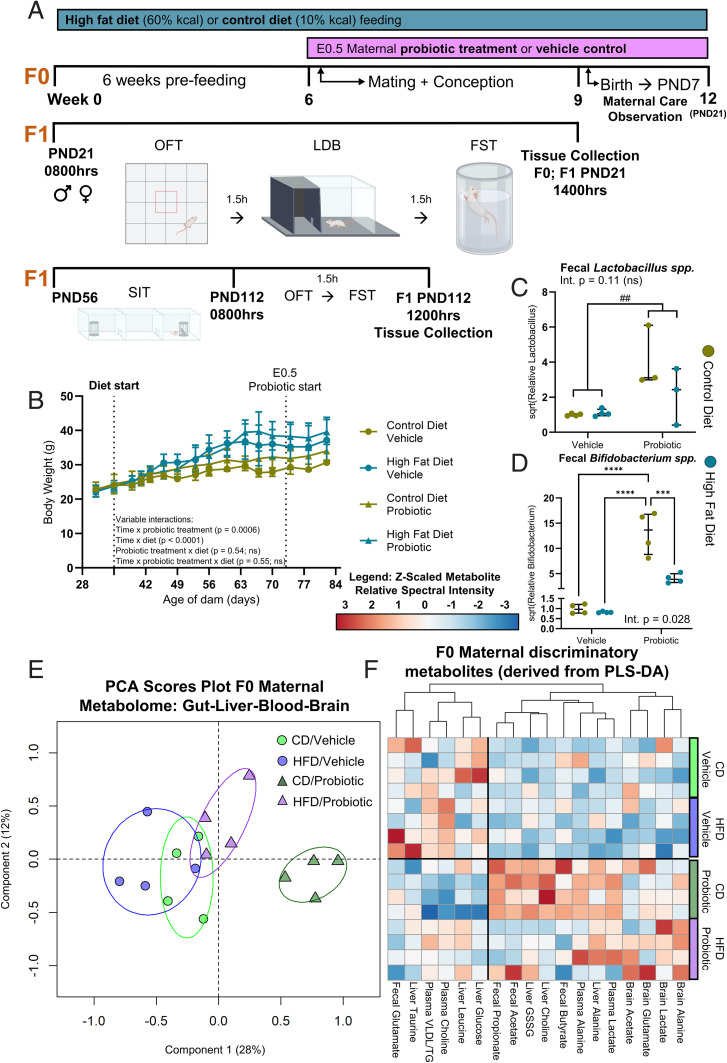
Fig. 1.
Effect of chronic HFD and perinatal probiotic treatment on F0 maternal Bifidobacterium spp., Lactobacillus spp., and gut, liver, plasma and brain metabolites. (A) Study design schematic. F0, maternal generation; F1, offspring generation. (B) Mixed-effects modeling of time, HFD, and probiotic treatment grouping on maternal body weight. Significant main effects of time [F(2.1,25.6) = 82.98, P < 0.0001] and diet [F(1,12) = 9.62, P = 0.0092] with significant time × probiotic [F(15,180) = 2.82] and time × diet [F(15,180) = 11.09] interactions. No main effect of probiotic treatment [F(1,12) = 1.24, P = 0.29]. (C) Maternal fecal Lactobacillus spp. levels. Probiotic treatment increased Lactobacillus spp. levels relative to vehicle controls [two-way ANOVA, main effect, F(1,10) = 12.51] independent of diet and without interaction [F(1,10) = 3.01]. (D) Maternal fecal Bifidobacterium spp. levels. Significant diet × probiotic interaction [Q(1,12) = 9.58]. Post hoc Tukey tests revealed that levels of Bifidobacterium spp. were highest in the CD/probiotic dams compared to all other groups. (E) PCA scores plot of all maternal gut, liver, plasma, and brain metabolites by 1H NMR spectroscopy. R 2X = 0.52 with three principal components. (F) Heatmap of key discriminatory maternal metabolites determined by PLS-DA. Data are presented as median ± interquartile range. ##P < 0.01 (indicating main effect of maternal probiotic treatment); ***P < 0.001; ****P < 0.0001 (indicating significant post hoc difference, computed only in the case of a significant diet × probiotic treatment interaction). Int., interaction; ns, not significant. n = 4 per group. Metabolomic descriptive statistics are reported in SI Appendix, Figs. S4–S7 and Tables S1–S5.

