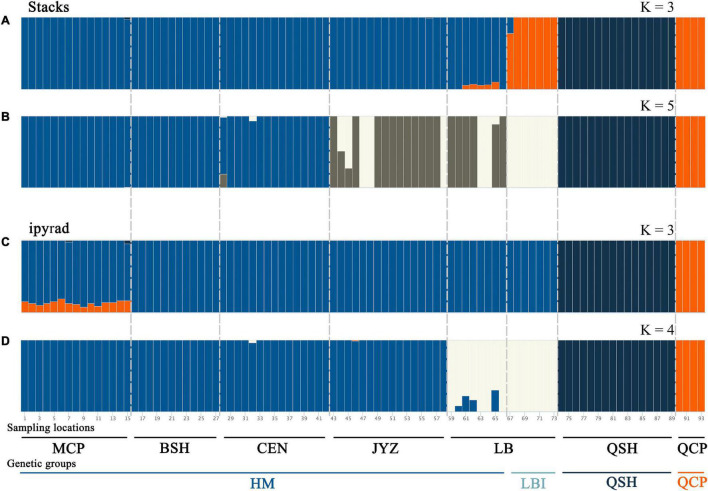
FIGURE 3.
Population structure of Magnolia fistulosa inferred by two data sets. Admixture results with (A) K = 3 and (B) K = 5 in the Stacks data set, (C) K = 3 and (D) K = 4 in the ipyrad data set. The two lines represent each sampling location and the genetic cluster divided by DAPC and PCA analyses.

