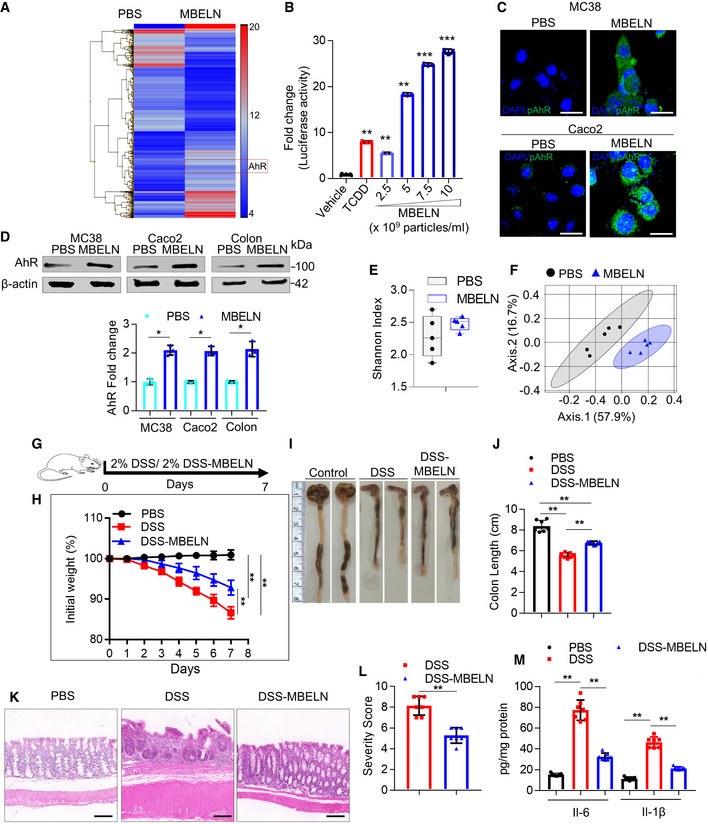
Figure 1. MBELNs activate AhR signaling.

-
AMice were orally administered with mulberry bark‐derived exosome‐like nanoparticles (MBELNs) (10 × 109 particles/100 µl/mouse) or phosphate‐buffered saline (PBS) for 7 days. Heat map showing influence of MBELNs on colonic gene expression from three biological replicates.
-
BIn vitro assessment of MBELN‐dependent induction of aryl hydrocarbon receptor (AhR) promoter using HEPA1.1 cells (contain AhR responsive luciferase reporter construct). Data are mean ± SEM from three biological replicates. **P < 0.01, ***P < 0.001 using one‐way ANOVA.
-
CRepresentative images showing expression of pAhR in MC38 cells and Caco2 cells treated with MBELNs from three biological replicates. Scale bar 20 μm.
-
DWestern blot (top) and graphical representation of fold changes (bottom) for AhR in MC38 cells, Caco2 cells, and colon epithelial cells after treatment with MBELNs. Data are mean ± SEM of three biological replicates. *P < 0.05 using Student’s t‐test.
-
EFecal microbiota were analyzed following administration of MBELNs (10 × 109 particle/100 µl/dose/day/mouse) for 7 days to C57BL/6 mice. Alpha diversity (Shannon index) was calculated at the family level and is displayed as a bar‐and‐whiskers plot for each individual combination of control and MBELN treatment. The center line represents the median and the box encloses the 1st and 3rd quartiles (“hinges”). The upper and lower whiskers represent the furthermost points from the respective hinges, which are no more than 1.5 interquartile ranges from the hinge. The individual points are overlaid. Data are presented from five mice or biological replicates.
-
FBeta diversity analysis, biplots samples (points), and bacterial taxa at family level (axes) are simultaneously projected on the two‐dimensional canonical axes (CA1 and CA2). Data are presented from five mice or biological replicates.
-
GPictorial representation of dextran sulfate sodium (DSS; 2%)‐induced colitis development in mice.
-
HGraph showing loss of weight following DSS‐induced colitis with and without MBELN treatment. Data are mean ± SEM of seven biological replicates, **P < 0.01 using Mann–Whitney test.
-
IRepresentative image showing changes in colon morphology and length following DSS‐induced colitis with concurrent treatment with MBELNs.
-
JColumn graph showing changes in colon length. Data are mean ± SEM from seven biological replicates, **P < 0.01 using one‐way ANOVA.
-
K, LHematoxylin and eosin (HE) staining to show histological changes in colon tissue (left) and a graph showing severity score (right) based on histological data. Scale bar 200 μm. Data are mean ± SEM of seven biological replicates, **P < 0.01 using Student’s t‐test.
-
MEnzyme‐linked immunosorbent assay (ELISA) for interleukin (IL)‐6 and IL‐1β from colon tissue. Data are mean ± SEM from seven biological replicates, **P < 0.01 using one‐way ANOVA.
Source data are available online for this figure.
