-
A
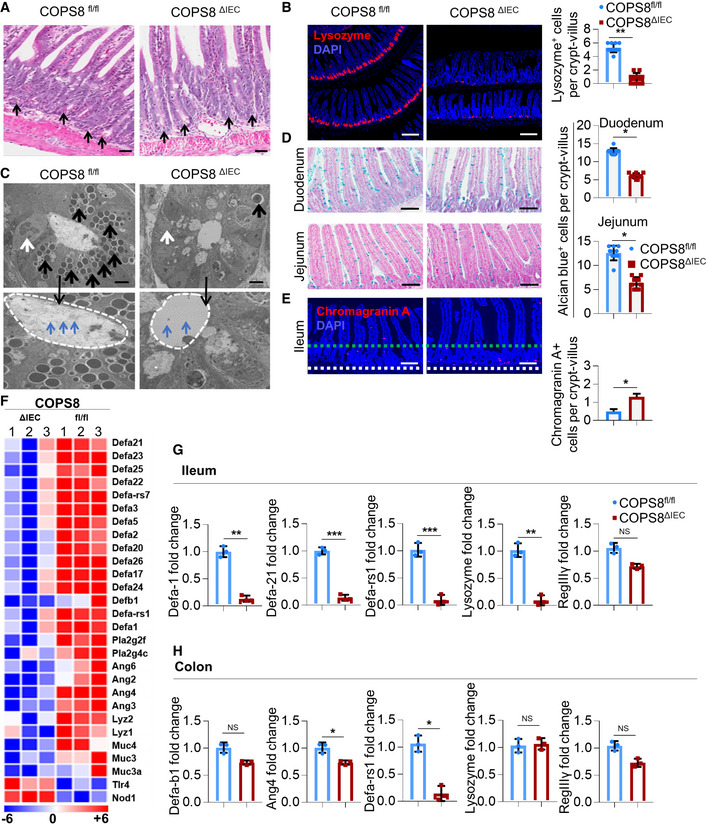
Representative hematoxylin and eosin (HE) staining of ileum. Paneth cells with typical eosinophilic granules (black arrows) on HE‐stained sections at the base of crypts in Villin‐Cre and COPS8‐lox alleles expressing (COPS8fl
/
fl
), but not COPS8 knockout (KO) (COPS8ΔIEC
) epithelium. Scale bar 50 μm, n = 7 biological replicate per genotype.
-
B
The granule protein, lysozyme, was examined by immunofluorescence (Red) and counted in the ileum of COPS8fl/fl
and COPS8ΔIEC
mice (scale bar 100 μm). The column graph represents number of lysozyme+ cells presented as mean ± SEM from seven biological replicates. **P < 0.01 using Student’s t‐test.
-
C
Transmission electron microscopy (TEM) of crypts of COPS8fl/fl
and COPS8ΔIEC
mice. The base of the crypt in COPS8ΔIEC
mice is occupied by poorly differentiated columnar epithelial cells that lack secretory granules, rudimentary electron‐dense granules (black arrows), granules in the lumen (blue arrows) and have a contracted endoplasmic reticulum (ER) (white arrows). Scale bar 5 μm, data are from seven biological replicates per genotype.
-
D
Goblet cells were stained by Alcian blue and counted in COPS8fl/fl
and COPS8ΔIEC
epithelia of duodenum and jejunum (scale bar 100 μm). The column graph represents number of Alcian blue+ cells presented as mean ± SEM from seven biological replicates. *P < 0.05 using Student’s t‐test.
-
E
The marker for enteroendocrine cells (between two dashed line), chromogranin, was detected by immunofluorescence and counted in the ileum of COPS8fl/fl
and COPS8ΔIEC
mice (scale bar 100 μm). The column graph represents number of chromogranin A+ cells per crypt‐villus presented as mean ± SEM from seven biological replicates. *P < 0.05 using Student’s t‐test.
-
F
RNA sequencing‐based measurements of transcripts comprising antimicrobial peptides (AMPs)‐related genes in crypts isolated from COPS8fl/fl
and COPS8ΔIEC
mice. Representative data from three biological replicates per genotype.
-
G, H
Real‐time quantitative reverse transcription polymerase chain reaction (PCR) (qRT–PCR) analysis of the expression of genes encoding AMPs in the ileum (G) and colon (H) in COPS8fl/fl
and COPS8ΔIEC
mice. Error bars indicate the mean ± SD from three biological replicates. *P < 0.05, **P < 0.01, ***P < 0.001 using Student’s t‐test.