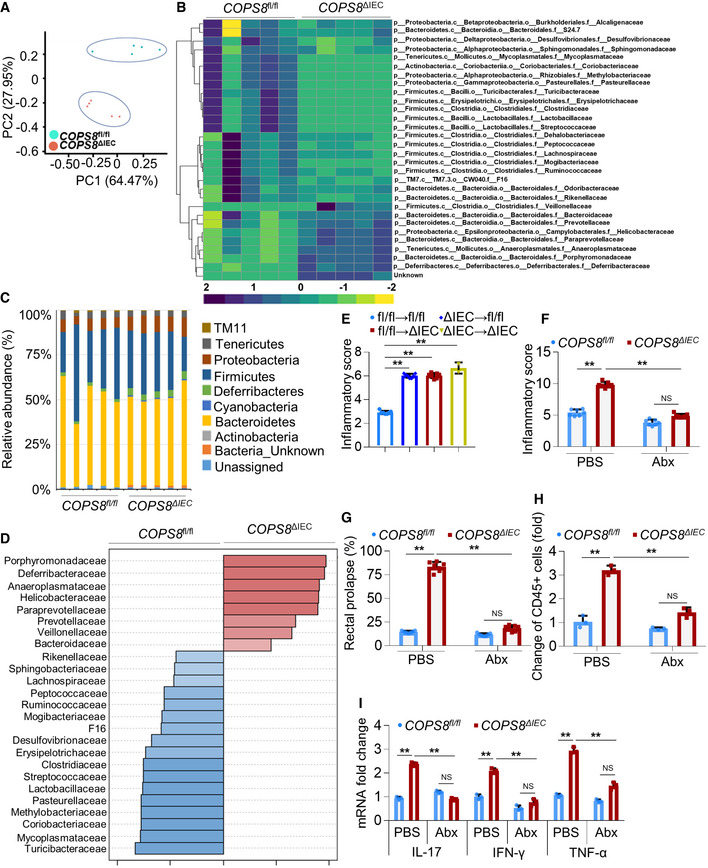
Principal components analysis of 16S rRNA gene‐sequencing analysis of gut microbes obtained from Villin‐Cre and COPS8‐lox alleles expressing (COPS8fl
/
fl
) and COPS8 knockout (KO) (COPS8ΔIEC
) mice. PC1 and PC2 explain the 64.47 and 27.95% variation, respectively. Representative data from five biological replicates per genotype.
Heatmap of differentially represented bacterial species in feces between COPS8fl
/
fl
and COPS8ΔIEC
mice. The top 30 genera that are shared by all of the samples shown. The scale was the percentage composition (log2) based on the 16S rRNA gene sequences analyzed using the Greengene database (gg_otus2013). The hierarchical clustering based on Spearman rank correlation (average linkage method) was performed using Gene Cluster 3.0 and images generated on Java Treeview. Representative data from five biological replicates per genotype.
The relative abundance of bacteria phylum in the feces of COPS8fl
/
fl
and COPS8ΔIEC
mice. Representative data from five biological replicates per genotype.
LEfSe analysis was applied to identify high‐dimensional biomarkers that discriminate between feces from COPS8fl
/
fl
and COPS8ΔIEC
mice. Representative data from five biological replicates per genotype.
Histologic severity scores of COPS8fl
/
fl
mice and COPS8ΔIEC
after fecal transplantation. Data represents the histological score of mice analyzed on day 160. Data are represented as mean ± SEM from seven biological replicates per genotype. **P < 0.01 using one‐way ANOVA.
Inflammation scores in the colon of 5‐month‐old COPS8fl
/
fl
and COPS8ΔIEC
mice. Data are represented as mean ± SEM from seven biological replicates per genotype. **P < 0.01, NS—non‐significant using one‐way ANOVA.
Percentage of rectal prolapse of 5‐month‐old mice COPS8fl
/
fl
and COPS8ΔIEC
. Data are represented as mean ± SEM from seven biological replicates per genotype. **P < 0.01, NS—non‐significant using one‐way ANOVA.
Flow cytometric analysis of CD45+ infiltrating immune cells in the lamina propria of the ileum. Data are represented as mean ± SEM from three biological replicates per genotype. **P < 0.01, NS—non‐significant using one‐way ANOVA.
Real‐time quantitative reverse transcription polymerase chain reaction (qRT–PCR) analysis of the expression of genes encoding inflammatory cytokines in the ileum. COPS8fl
/
fl
and COPS8ΔIEC
mice were either untreated (phosphate‐buffered saline (PBS)) or treated with the antibiotic cocktail (Abx) for 3 months. Data are mean ± SEM from three biological replicates. **P < 0.01, NS—non‐significant using one‐way ANOVA.

