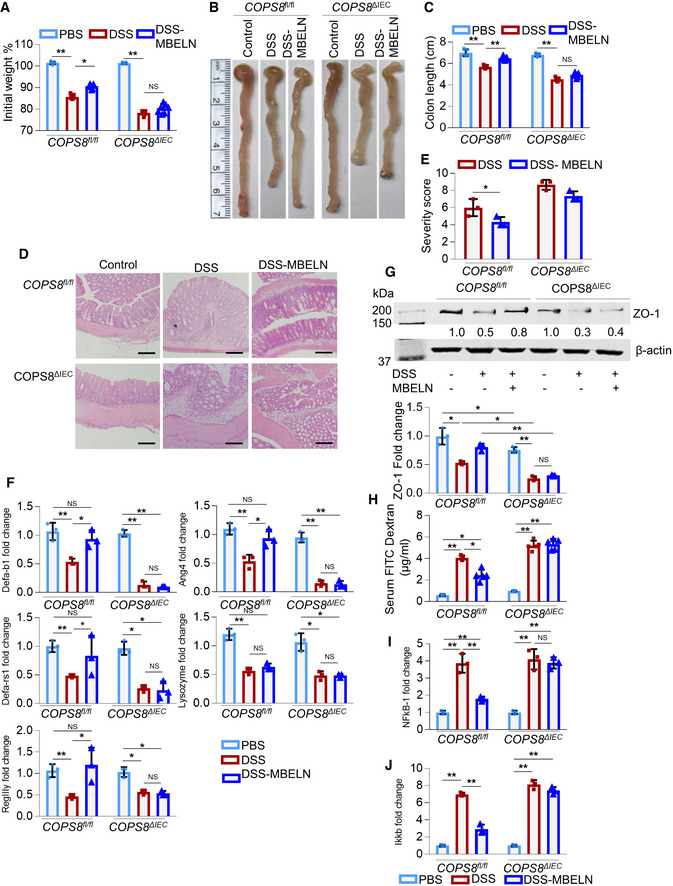
Figure 6. Intestinal epithelial COPS8 is required for MBELN‐mediated protection against mouse colitis.

-
AGraph showing loss of weight following oral dextran sodium sulfate (DSS) (2%) treatment with and without mulberry bark‐derived exosome‐like nanoparticles (MBELNs) for 7 days (10 × 109 particles/dose/day/mouse) once daily for 7 days in Villin‐Cre and COP9/COP9 constitutive photomorphogenic homolog subunit 8 (COPS8)‐lox alleles expressing (COPS8fl / fl ) and COPS8 knockout (KO) (COPS8ΔIEC ) mice. Changes in body weight are presented as percent of initial weight determined using Mann–Whitney test, *P < 0.05, **P < 0.01, NS—non‐significant. Representative data from seven biological replicates per genotype.
-
BRepresentative image showing changes in colon morphology and length following DSS‐induced colitis with concurrent treatment with MBELNs COPS8fl / fl and COPS8ΔIEC mice. Representative data from seven biological replicates per genotype.
-
CColumn graph showing changes in colon length. Data are mean ± SEM from seven biological replicates. **P < 0.01, NS—non‐significant using one‐way ANOVA.
-
D, EHematoxylin and eosin staining (HE) to show histological changes (D) and graph showing severity scores based on histological data (E). Scale bar 200 μm, column graph represents colon severity score, presented as mean ± SEM from three biological replicates per genotype. *P < 0.05, NS—non‐significant using Student’s t‐test.
-
FExpression of anti‐microbial peptide (AMPs) in the colon of COPS8fl / fl and COPS8ΔIEC mice while being treated with MBELNs by oral administration. Data are mean ± SEM from three biological replicates per group. *P < 0.05, **P < 0.01, NS—non‐significant using one‐way ANOVA. (G) Protein expression tight junction protein Zonula occludens‐1 (ZO‐1) using Western blotting in colonic intestine epithelial cells. Data are mean ± SEM from three biological replicates per group. *P < 0.05, **P < 0.01, NS—non‐significant using one‐way ANOVA.
-
HMeasurement of serum fluorescein isothiocyanate (FITC)‐dextran to evaluate the permeability of the intestines. Data are mean ± SEM from five biological replicates per group. *P < 0.05, **P < 0.01 using one‐way ANOVA.
-
I, JTranscriptional expression of nuclear factor kappa B (NF‐κB) (I) and inhibitor of nuclear factor kappa‐β kinase (IKK‐β) (J) mRNA using real‐time quantitative reverse transcription polymerase chain reaction (qRT–PCR) in colonic epithelial cells upon treatment with MBELNs in addition to DSS. Data are mean ± SEM from three biological replicates per group. **P < 0.01, NS—non‐significant using one‐way ANOVA.
Source data are available online for this figure.
