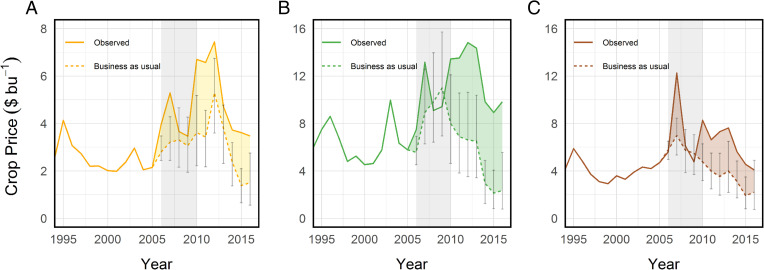
Fig. 1.
Observed and BAU estimates for crop prices. (A) Corn. (B) Soybeans. (C) Wheat. Vertical bars represent the 95% CIs for each BAU spot price. Each year denotes a crop year; e.g., 2006 is September 2006 to August 2007 for corn and soybeans and June 2006 to May 2007 for wheat. Averages for 2006 to 2010 (highlighted in gray) were used to derive the estimates in the text, although long-run persistent impacts were consistent with these results (46).

