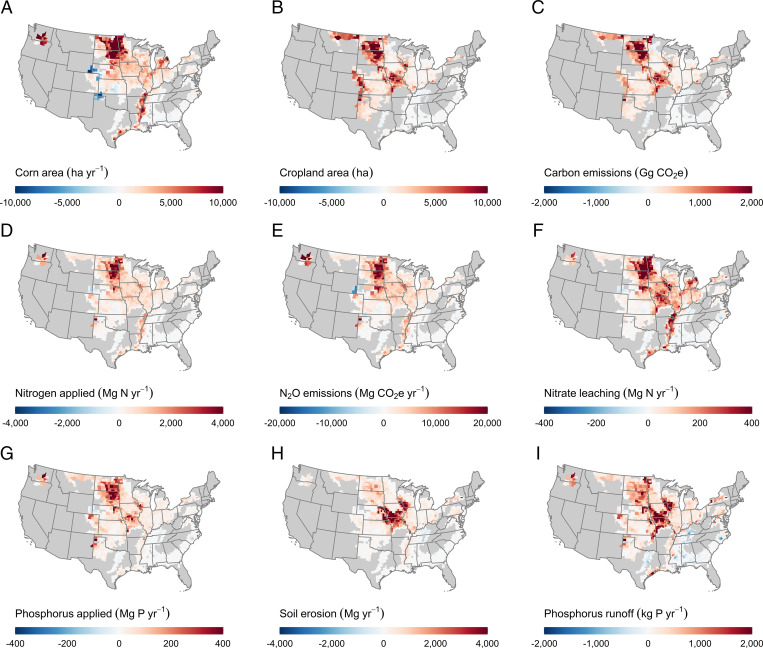
Fig. 2.
Changes due to the RFS. (A) Corn planted area. (B) Cropland area. (C) Carbon emissions. (D) Nitrogen applications. (E) Nitrous oxide emissions. (F) Nitrate leaching. (G) Phosphorus applications. (H) Soil erosion. (I) Phosphorus runoff. Positive numbers indicate an increase due to the RFS. Field-level results were aggregated to the county level for enumeration and visualization.

