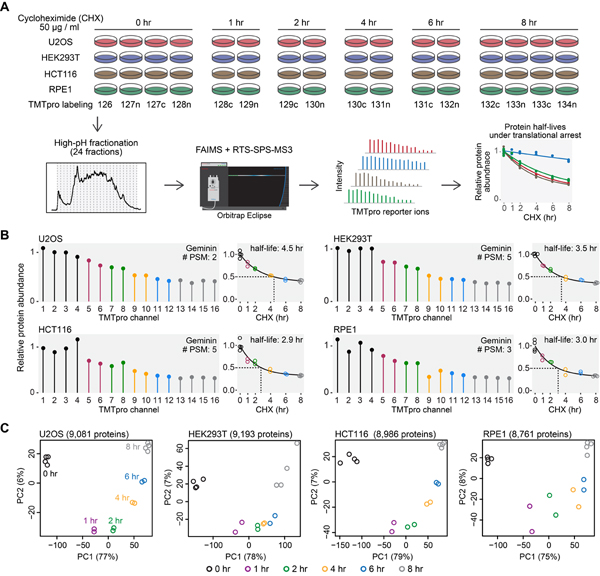
Figure 1. An overview of the experimental design.
(A) Cells were treated with cycloheximide, and samples were digested and then labeled with TMTpro 16-plex reagents. Labeled samples were fractionated and concatenated into 24 fractions. Samples were analyzed on an Orbitrap Eclipse mass spectrometer with high-field asymmetric-waveform ion mobility spectrometry (FAIMS) and real-time-search (RTS)-synchronous-precursor-selection (SPS)-MS3. Relative protein abundance was used to calculate protein half-lives under translational inhibition. (B) Relative protein abundance and half-lives of Geminin. Geminin is a known short-lived protein. #PSM is the number of peptide-spectrum-matches. A protein with a PSM count of three means that the protein’s quantification is based on a weighted average of three quantified peptides. (C) Replicate samples grouped together in principal component analysis. Samples collected at different time points were separated mainly on the first principal component (PC1). Relative protein abundance is TMTpro signal-to-noise normalized to the mean of the first time point in panel A and B. See also Figure S1 and Table S1.

