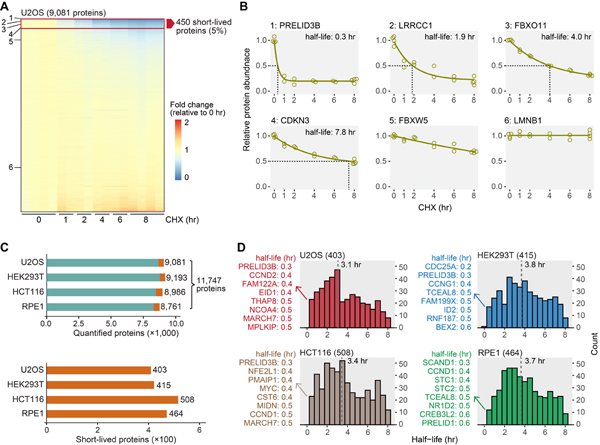
Figure 2. Overview of short-lived proteins under translational arrest.
(A) A representative view of quantified proteins and short-lived proteins. Deep proteome coverage was achieved (>9,000 proteins) and only a small fraction of the quantified proteome (~5%) was short-lived in U2OS cells. Six proteins with diverse half-lives are highlighted in panel B. (B) Example degradation curves showing proteins with variable stability. Relative protein abundance is TMTpro signal-to-noise normalized to the mean of the first time point. (C) The number of quantified proteins (upper panel) and short-lived proteins (lower panel). About 4.4%−5.3% of the quantified proteome was short-lived (orange blocks in the upper panel). (D) Distributions of short-lived protein half-lives. Values in parentheses are numbers of short-lived proteins. The eight most short-lived proteins and their half-lives are shown on the left. Bin size is 0.5 hr. The dashed lines indicate medians. See also Figure S2 and Table S2.

