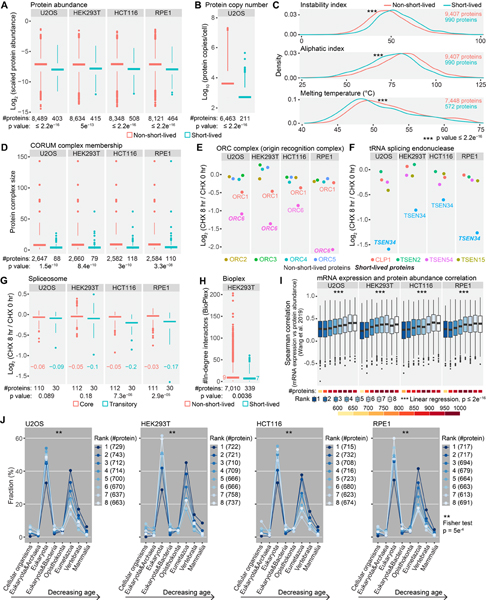
Figure 5. Evaluating the properties of short-lived proteins under translational arrest.
(A) Short-lived proteins were less abundant than other proteins. Scaled protein abundance is TMTpro signal-to-noise (SN) normalized by protein length and the fraction of TMTpro SN at 0 hr among summed TMTpro SN. (B) Short-lived proteins displayed lower protein copies/cell than other proteins in U2OS cells. (C) Short-lived proteins showed higher instability indices, higher aliphatic indices and lower melting temperatures than non-short-lived proteins. The list of short-lived proteins contains proteins that were short-lived in at least one cell line. (D) Short-lived proteins tended to reside in smaller protein complexes. (E) ORC1 and ORC6 are loosely attached subunits of the origin recognition complex with shorter half-lives than other subunits. (F) TSEN34 of tRNA splicing endonuclease showed a higher degradation rate than other subunits. (G) Spliceosome components that are assembled or disassembled dynamically between different spliceosome conformational states (transitory subunits) presented greater losses at 8 hr, especially in HCT116 and RPE1 cells. Numbers in the plot are median log2 fold changes. (H) Short-lived proteins had fewer interacting proteins than other proteins in HEK293T cells. Numbers in the plot are median in-degree interactions. (I) Rapidly degraded proteins showed lower mRNA expression and protein abundance correlation across human tissues compared to stable proteins. (J) Short-lived proteins were evolutionarily younger than stable proteins. Numbers in parentheses are bin size. Rank 1 and 8 represent the least and the most stable proteins, respectively in panel I and J. Statistical significance was determined by unpaired Wilcoxon test (two-sided) in panel A-D, G and H. Data are presented as box plots (center line: median; box limits: the first and third quartiles; whiskers: 1.5x interquartile range) in panel A, B, D and G-I. See also Figure S5.

