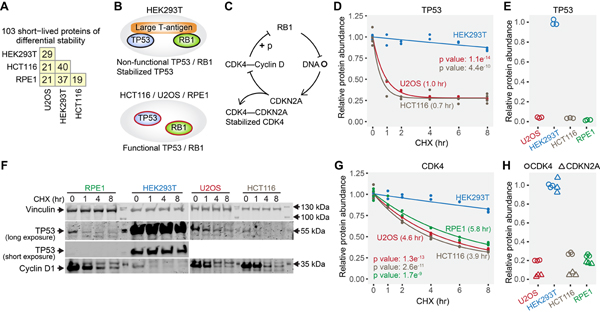
Figure 6. Cell line specific differences in the stability of short-lived proteins.
(A) Numbers of short-lived proteins with differential stability between any two cell lines. (B) HEK293T expresses large T-antigen, which binds TP53 and RB1 proteins and renders them non-functional. TP53 is stabilized by its interaction with large T-antigen. (C) Non-functional RB1 results in higher expression of CDKN2A, which competitively binds and stabilizes CDK4. (D) The fast degradation of TP53 in U2OS and HCT116, and the stabilization of TP53 by interaction with large T-antigen in HEK293T were captured by the mass spectrometry data. Values in parentheses are half-lives. TP53 was not identified in RPE1 cells, presumably due to its very low abundance. (E) TP53 showed higher protein abundance in HEK293T due to stabilization by large T-antigen. (F) Western blotting shows that TP53 was long-lived only in HEK293T cells. Cyclin D1 is a known short-lived protein (positive control). (G) The stabilization of CDK4 uniquely in HEK293T cells. (H) CDKN2A and CDK4 have higher overall protein expression levels in HEK293T cells. Relative protein abundance is TMTpro signal-to-noise normalized to the mean of the first time point in panel D and G. Relative protein abundance is TMTpro signal-to-noise normalized to the maximum in panel E and H. Note that relative protein abundance is comparable for the same protein across different cell lines, and not comparable for different proteins in the same cell line in panel H. See also Figure S6 and Table S3.

