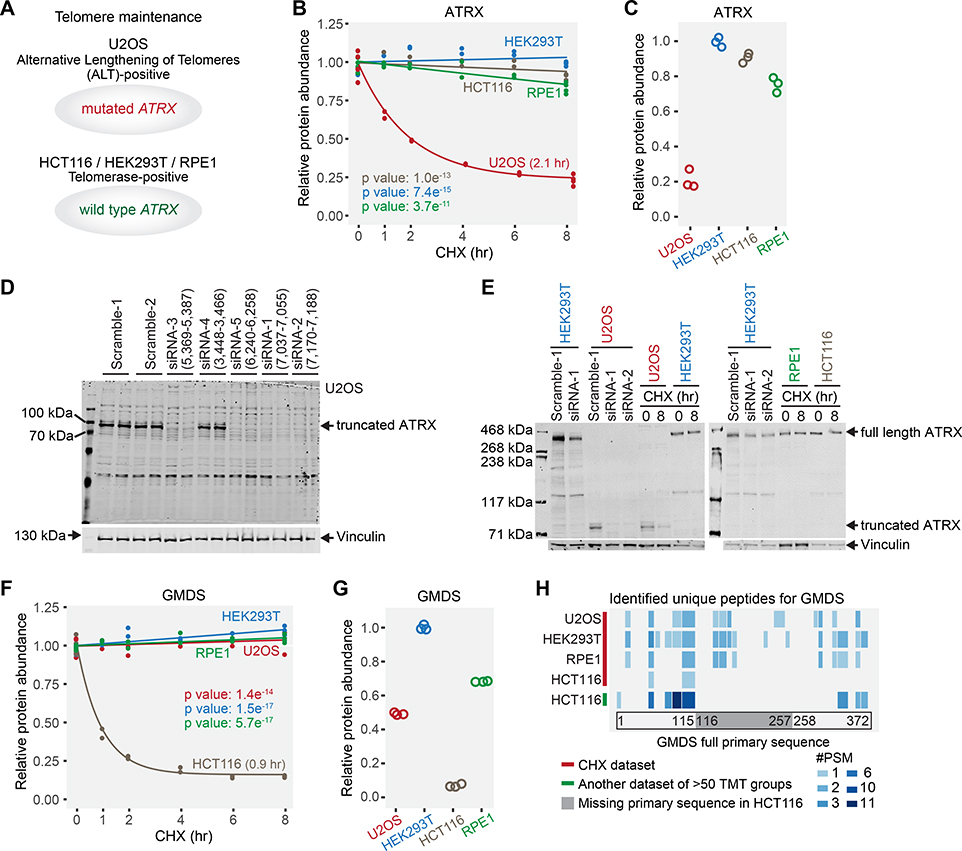
Figure 7. Examples of truncated protein forms unique to one cell line with concomitant short half-lives.
(A) U2OS is an alternative lengthening of telomeres-positive cell line with a mutated ATRX gene. The other three are telomerase-positive cell lines carrying the wild type ATRX gene. (B) ATRX in U2OS cells displayed a significantly shorter half-life than other cell lines. (C) ATRX expression levels in U2OS cells are lower than other cell lines. Only ATRX peptides that were identified in U2OS cells were used for quantification. (D) siRNA experiments verified that U2OS cells expressed a truncated form of ATRX protein. siRNAs (siRNA-1, siRNA-2, siRNA-3, and siRNA-5) targeting the remaining exons abolished the detection of the truncated ATRX, while scramble siRNAs and siRNA (siRNA-4) targeting a deleted exon did not. (E) Western blotting results showed that the truncated form of ATRX was short-lived in U2OS cells, while full length ATRX was not in other cell lines. (F) GMDS has a significantly shorter half-life (0.9 hr) in HCT116 cells. (G) GMDS is expressed at a much lower level in HCT116 cells. Only GMDS peptides that were identified in HCT116 cells were used for quantification. (H) Evidence of GMDS truncation based on peptide sequencing. No GMDS peptides were identified in the deletion region in HCT116 cells in this study or in another large unpublished HCT116 dataset from our lab. However, GMDS peptides were identified throughout the full primary sequence at an equivalent frequency in other cell lines. #PSM means the number of peptide-spectrum-matches (how many times the peptide was detected). Blue blocks indicate the identified peptides and their positions in the full primary sequence. Light gray in the same row indicates no peptide detected in the corresponding position. Relative protein abundance is TMTpro signal-to-noise normalized to the mean of the first time point in panel B and F. Relative protein abundance is TMTpro signal-to-noise normalized to the maximum in panel C and G. See also Figure S7.

