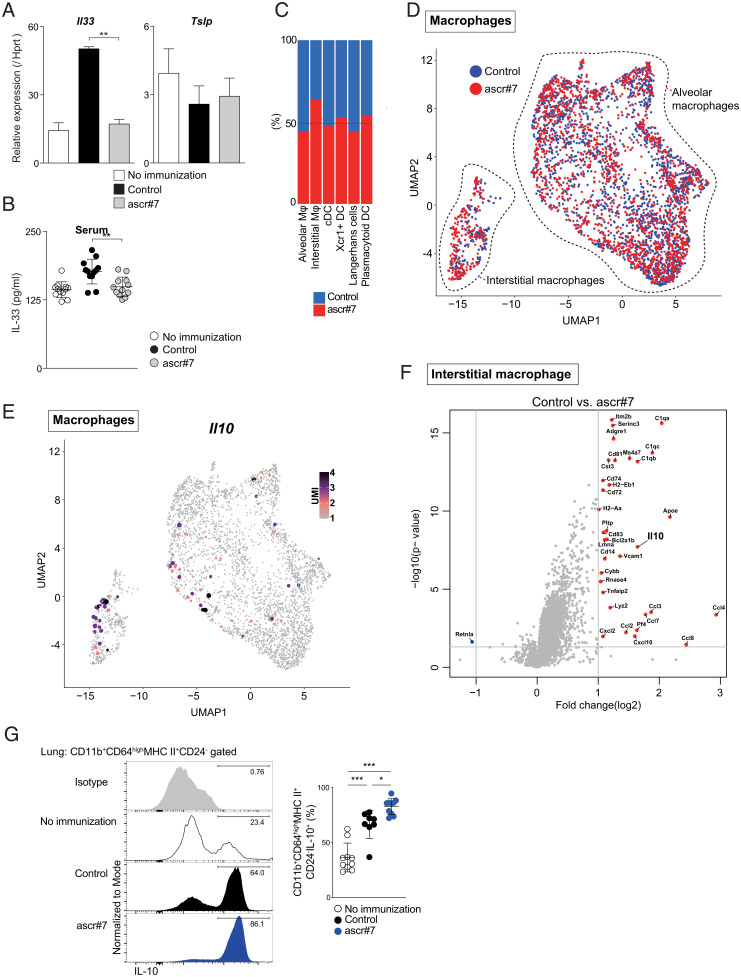
Fig. 5.
Ascr#7 suppresses type 2 immunity in vivo. (A) CD45−PECAM−EpCAM+ cells were sorted from lungs of immunized mice, and qRT-PCR of Il33 and Tslp was performed. (B) Serum IL-33 levels in mice were measured by ELISA. (C) Proportion of macrophages and dendritic cells in clusters of alveolar macrophages, interstitial macrophages, cDCs, Xcr1+ DCs, Langerhans cells, and plasmacytoid DCs. (D) Expression of macrophages selected from the original dataset projected onto a UMAP. (E) Expression of Il10 projected onto a UMAP. (F) This volcano plot depicts differential gene expression following administration of ascr#7 compared to control interstitial macrophages. Mice were sensitized with synthetic ascr#7 plus OVA in alum on days 0 and 14, and then challenged with i.n. administration of OVA or PBS. Six days after the challenge, the indicated assays were performed as described in SI Appendix, Fig. S5E. (G) Representative intracellular staining profiles of IL-10 gated on CD11b+CD64highMHC class ll+CD24− cells are shown (Left). Percentages of IL-10–producing cells in CD11b+CD64highMHC class ll+CD24− cells are shown (Right). Data from one experiment are representative of two independent experiments (Left) and pooled from two independent experiments (Right). Mean values from at least eight mice per group are shown with SD. *P < 0.05, **P < 0.01, ***P < 0.001.

