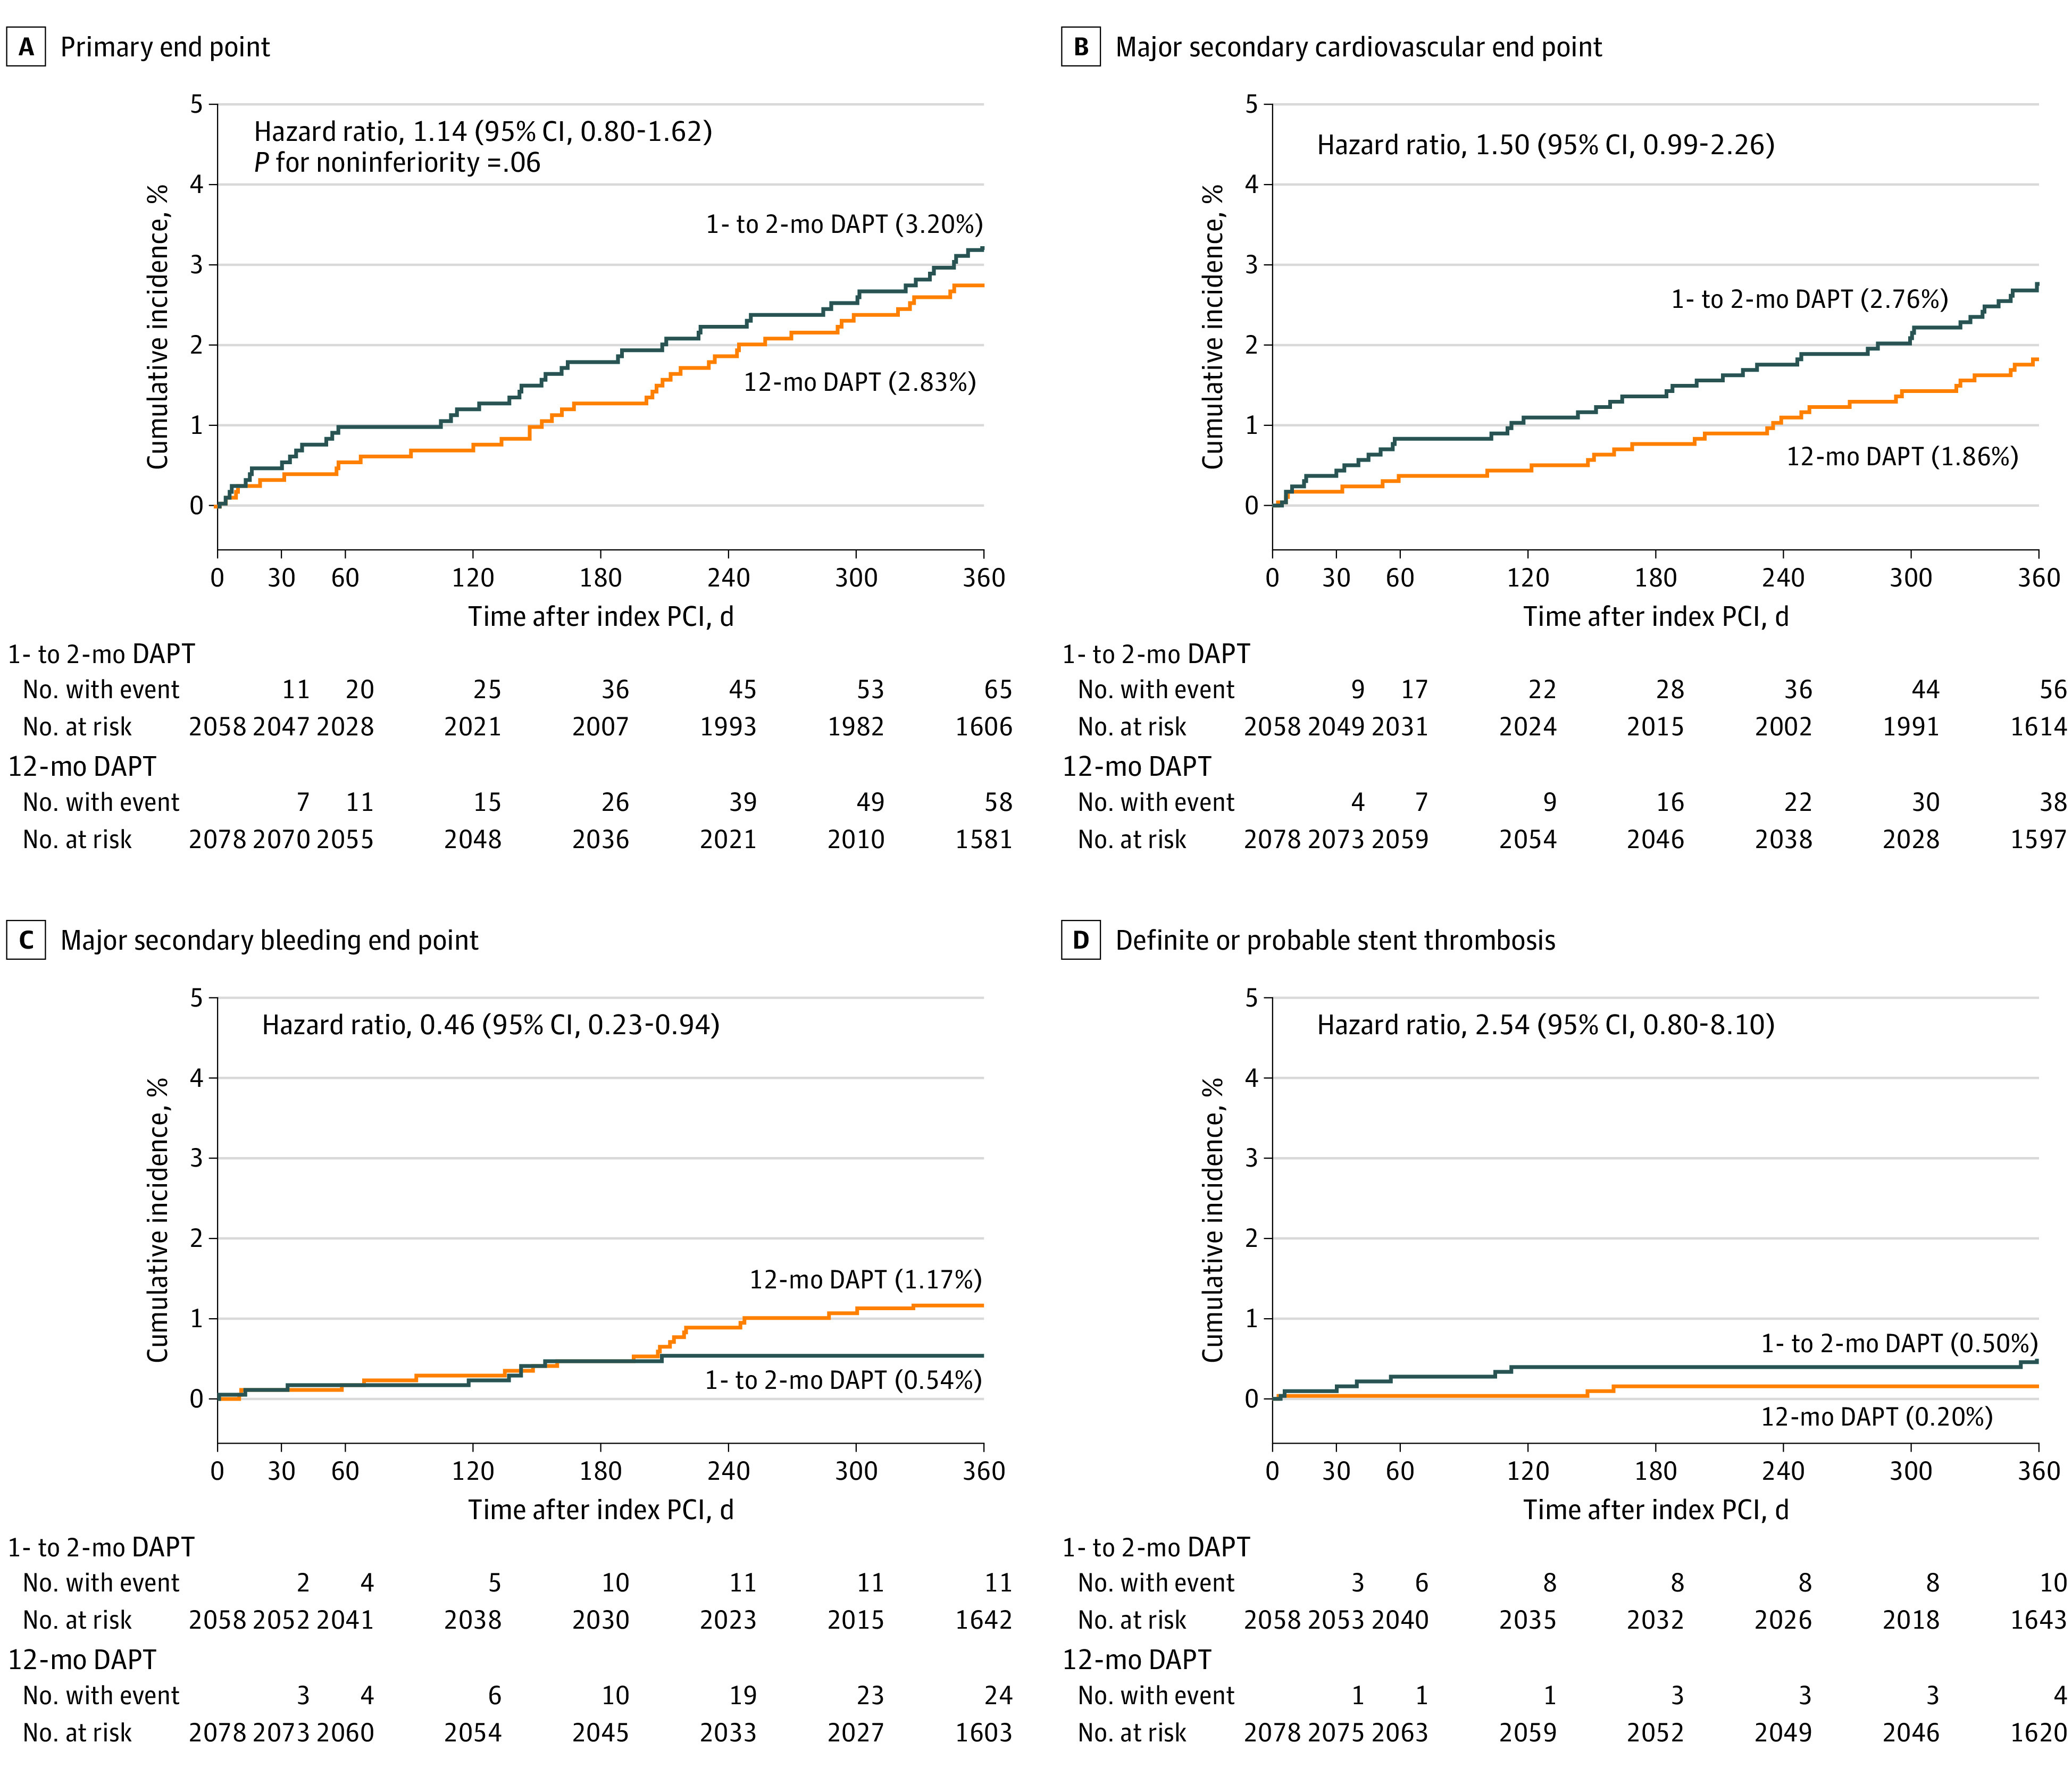
Figure 2. Time-to-Event Curves for the Primary and Secondary End Points.

Time-to-event curves during 1 year after index percutaneous coronary intervention (PCI) for the primary end point (a composite of cardiovascular death, myocardial infarction, definite stent thrombosis, any stroke, or Thrombolysis in Myocardial Infarction major/minor bleeding) (A), the major secondary cardiovascular end point (a composite of cardiovascular death, myocardial infarction, definite stent thrombosis, or any stroke) (B),the major secondary bleeding end point (Thrombolysis in Myocardial Infarction major or minor bleeding) (C), and definite or probable stent thrombosis (D). DAPT indicates dual antiplatelet therapy.
