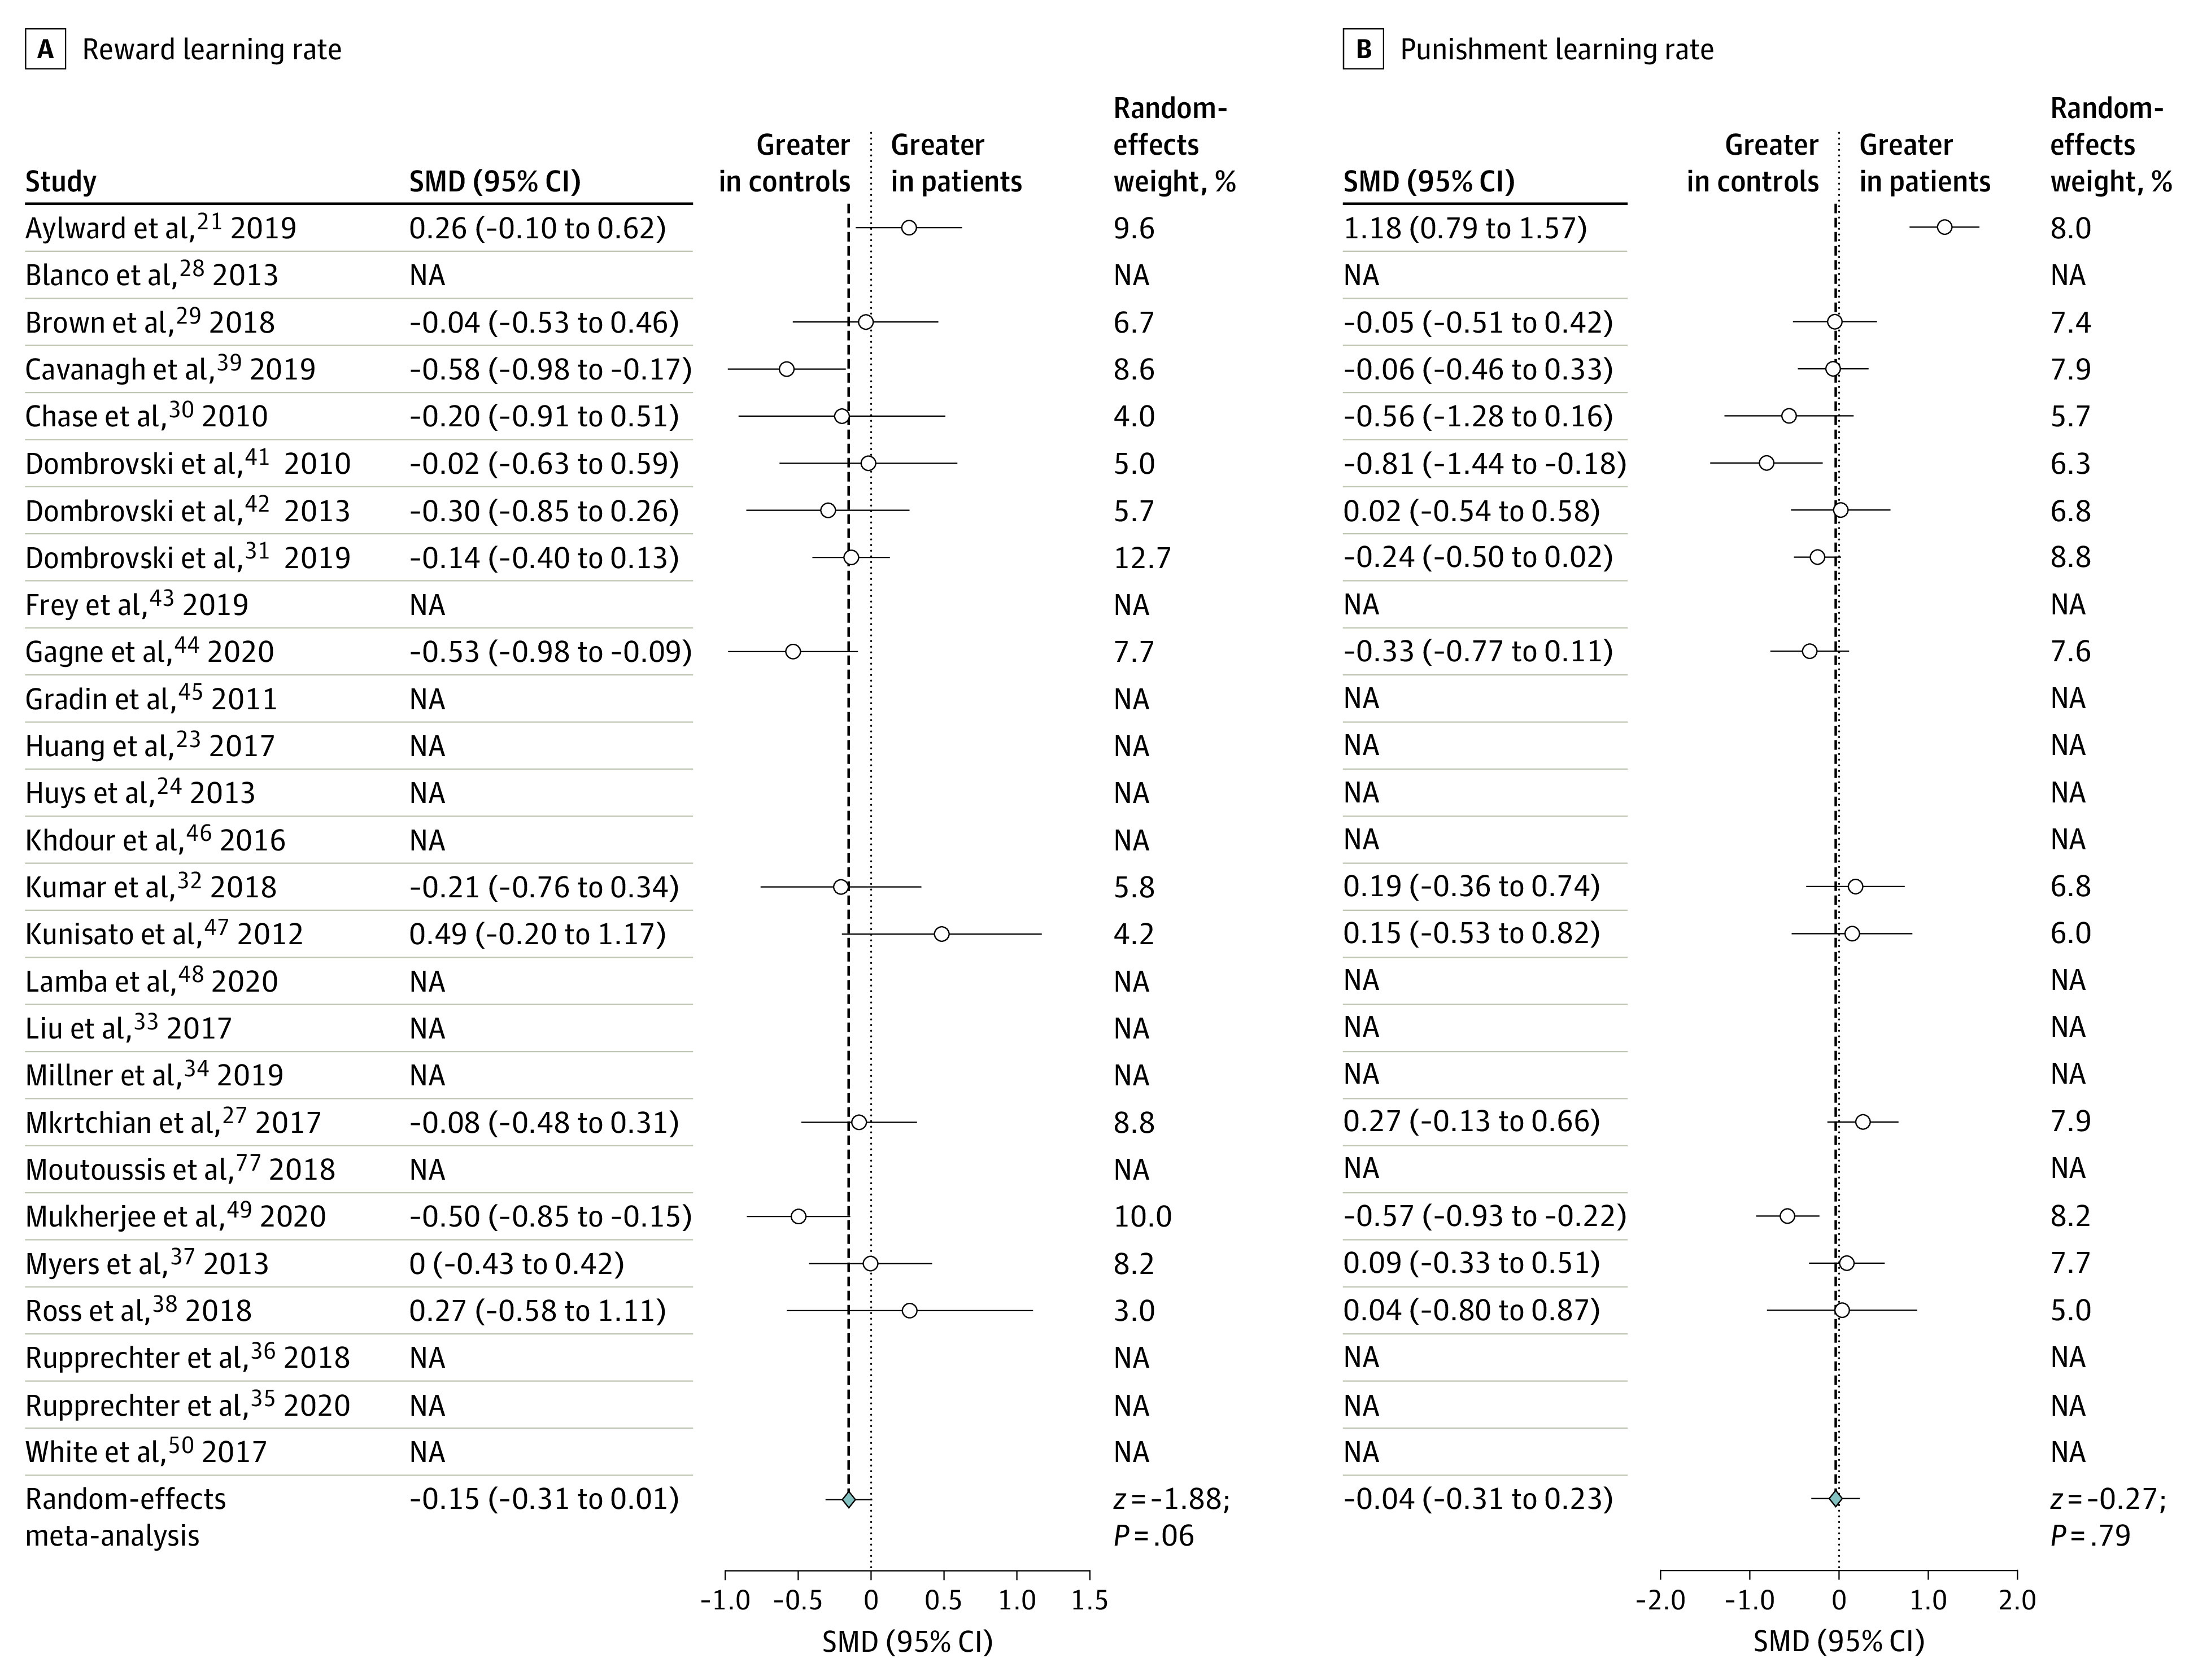
Figure 3. Forest Plots for the Conventional Meta-analysis Comparing Reward Learning Rate and Punishment Learning Rate.

The figure shows standardized mean differences (Hedges g) between patients and control individuals. Where the relevant parameter was not included in the original article, the standardized mean difference is marked as not applicable (NA). SMD indicates standardized mean difference.
