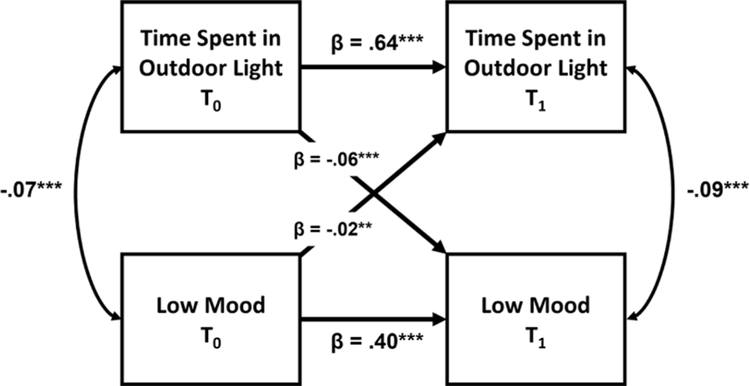
Fig. 1.
Autoregressive, cross-lagged (ARCL) model diagram for the longitudinal effect of time spent in outdoor light during the day on the frequency of low mood symptoms between the first (T0) and second (T1) waves of the UK Biobank study. Auto-regressive paths occur between waves of the same measure (e. g. Depressed Mood T0 -> Depressed Mood T1) as a measure of consistency, synchronous paths occur between measures within a wave (e.g. Time Spent in Outdoor Light T0 -> Depressed Mood T0) as a measure of cross-sectional association, and cross-lagged paths occur between measures across waves (e.g. Time Spent in Outdoor Light T0 -> Depressed Mood T1) as a measure of longitudinal association and temporal precedence.

