Figure 3.

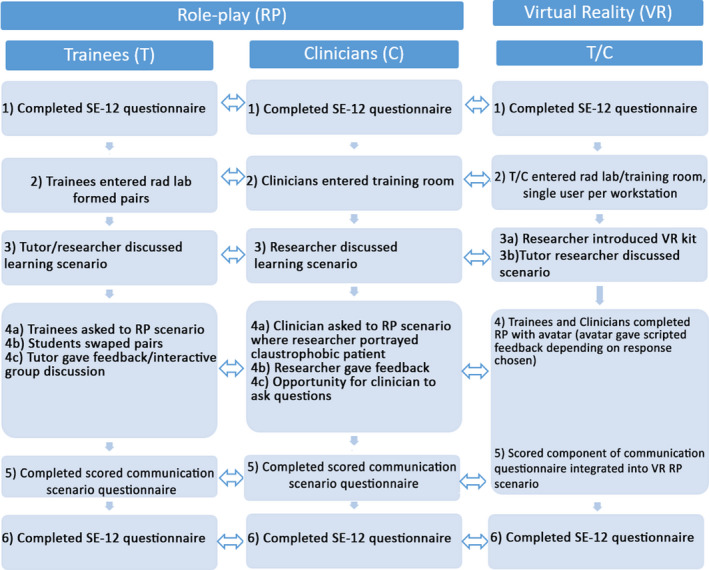
A flow chart showing the procedure for each of the experiment groups (RP and VR, for both Trainee and Clinician). Equivalent steps are indicated by a double‐head arrow.

A flow chart showing the procedure for each of the experiment groups (RP and VR, for both Trainee and Clinician). Equivalent steps are indicated by a double‐head arrow.