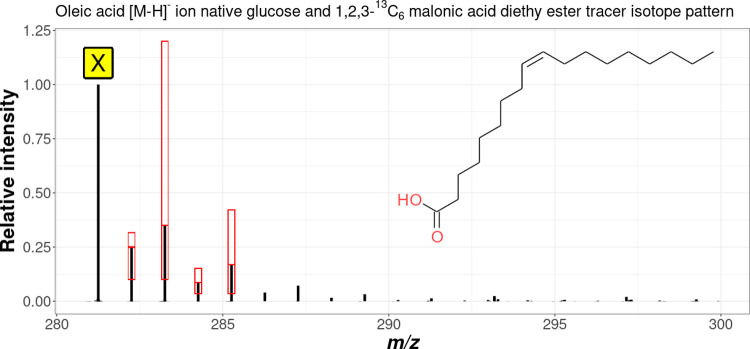
Figure 4.
Measured spectrum of the [M – H]− ion of oleic acid in the mycelium extract samples of F. graminearum using the standard tracer approach. X denotes the predominant, monoisotopic, native deprotonated molecule. Also shown in red boxes are the isotopologs defined in the rules that must be present and their permitted intensity ranges.

