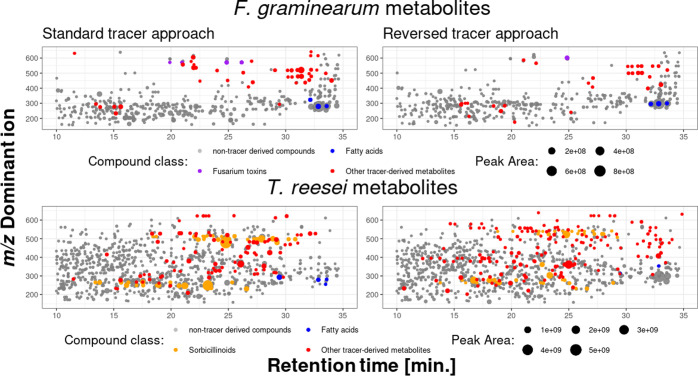
Figure 8.
Mass-retention time plots of the dominant ion of each feature group from all truly fungal-derived metabolites found by MetExtract II software (shown in gray) in the sample data sets of F. graminearum and T. reesei (all three genotypes) culture samples. Metabolites detected by CPExtract are shown in purple (known F. graminearum metabolites), yellow (known T. reesei metabolites), blue (fatty acids), or red (unknown, potential novel tracer-derived metabolites), illustrating the comparability of both tracer approaches and the filter effect of the targeted search for tracer-derived metabolites.

