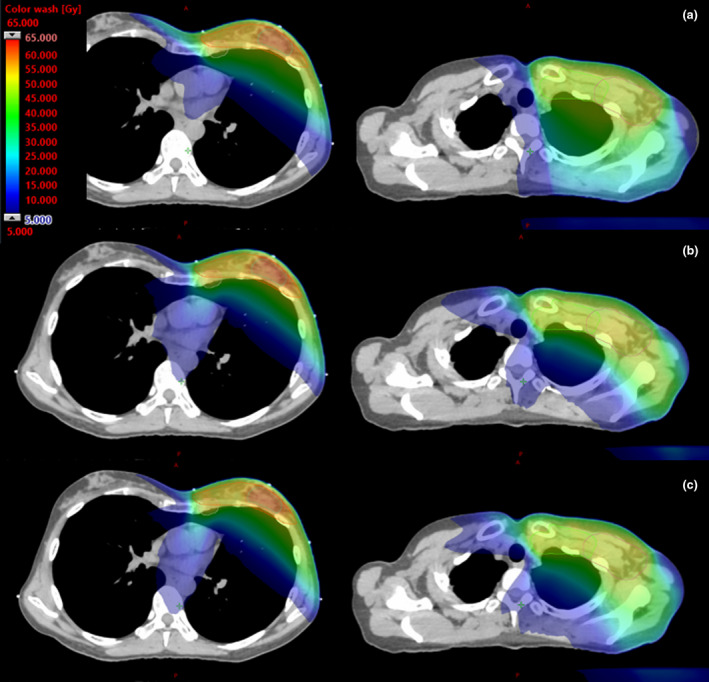
Figure 3.

Dose distribution comparison. An example dose distribution achieved by each planning technique on the same left breast DIBH patient for (a) h‐VMAT, (b) bowtie‐VMAT and (c) ipsi‐VMAT techniques. The PTV breast (red), tumour bed (blue), supraclavicular fossa (green), axilla (maroon) and internal mammary chain (pink) are displayed and dose wash on CT slices through the inferior (left) and superior (right) target volumes presented.
