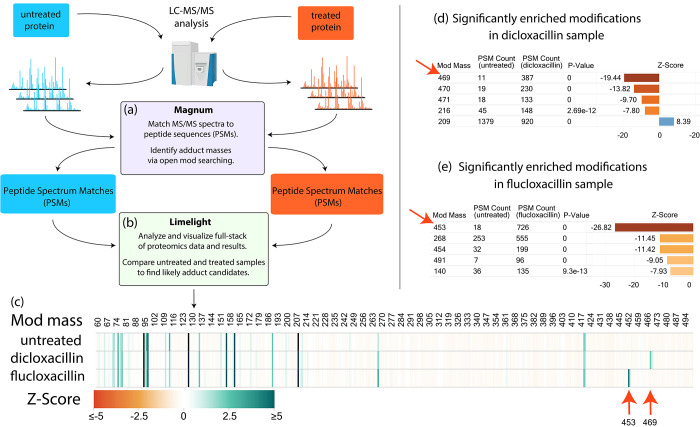
Figure 3.
Adduct identification and visualization workflow using dicloxacillin or flucloxacillin exposed versus untreated HSA as an example. (a) Raw MS data was searched using Magnum and (b) resulting PSMs were analyzed by Limelight. Data visualization includes: (c) a heatmap of Global z-score for all modification masses across all samples highlighting modification masses enriched in the treated samples (red arrows); (d) results of statistical test of proportions on all modification masses automatically pinpoints dicloxacillin (469 Da) and (e) flucloxacillin (453 Da) adducts (red arrows). See Supplementary Note 3 for details. All results shown have a Percolator calculated PSM level q ≤ 0.01. Exact modification masses were binned into 1 Da bins by Limelight prior to analysis. Live view for (c) can be found on Limelight here: https://limelight.yeastrc.org/limelight/go/x1h2QRXqrE

