
Figure 2.
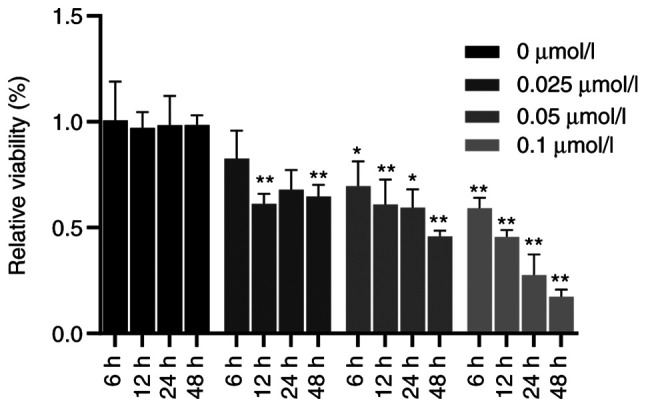
Effects of different concentrations of thapsigargin at different incubation times on the activity of U87-MG glioma cells as determined by a Cell Counting Kit-8 assay. Values are expressed as the mean ± standard deviation (n=3). *P<0.05, **P<0.01 vs. control.