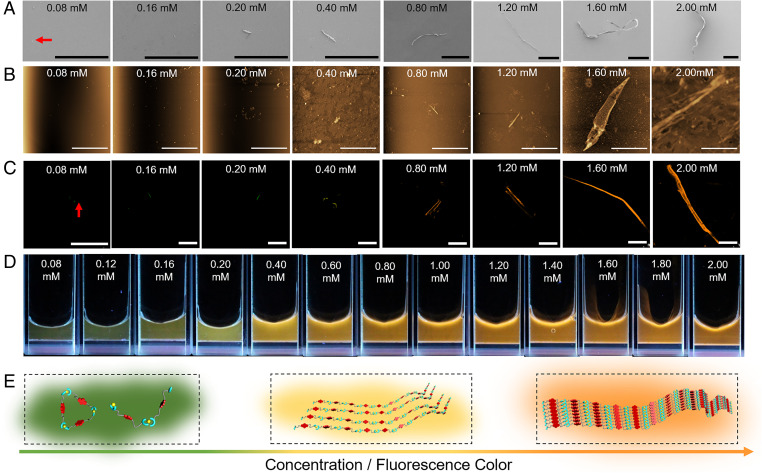
Fig. 3.
Morphology, fluorescence behavior, and proposed determinants of the observed M1 + Zn(OTf)2 emission colors. (A) SEM images, (B) AFM images, and (C) LSCM images of the equimolar mixtures of M1 and Zn(OTf)2 at different concentrations (0.08, 0.16, 0.20, 0.40, 0.80, 1.20, 1.60, and 2.00 mM in DMF/H2O (1/4, vol/vol)). λex = 405 nm. (D) Photographs of equimolar mixtures of M1 and Zn(OTf)2 (0.08 to 2.00 mM) under UV light. (E) Cartoon representations of the self-assembly process thought to govern equimolar mixtures of M1 and Zn(OTf)2 and the change in the fluorescence color observed as the concentration is increased. (Scale bars: A, 200 μm; B, 20.0 μm; C, 100 μm.)

