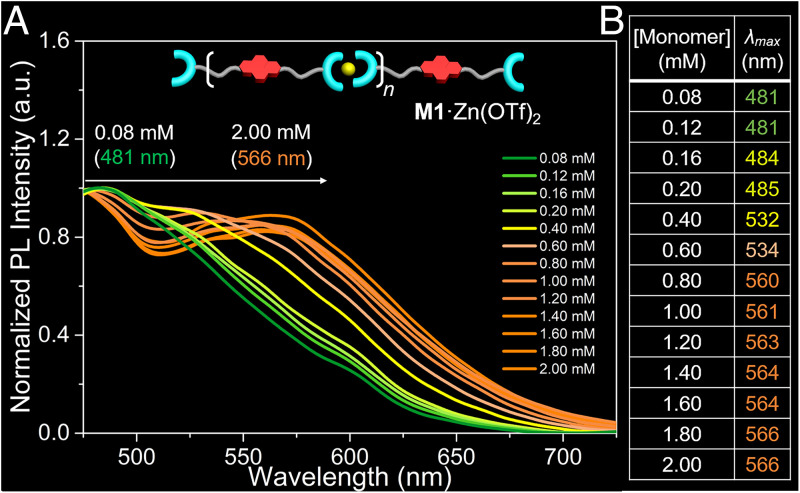
Fig. 4.
Fluorescence characterization of [M1·Zn(OTf)2]n (A) Normalized fluorescent spectra of equimolar mixtures of M1 and Zn(OTf)2 in the concentration range (0.08 to 2.00 mM in DMF/H2O [1/4, vol/vol]) at 298 K. λex = 410 nm. Slit: 10/15. (B) Table showing the relationship between λmax and monomer concentration.

