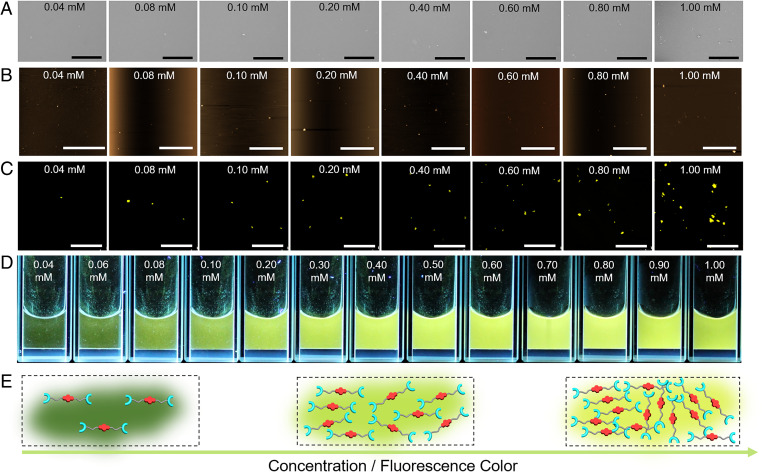
Fig. 6.
Morphology, fluorescence behavior, and origin of the M1-derived fluorescence. (A) SEM images, (B) AFM images, and (C) LSCM images of M1 solutions at different concentrations (0.04, 0.08, 0.10, 0.20, 0.40, 0.60, 0.80, and 1.00 mM in DMF/H2O [1/4, vol/vol]). λex = 405 nm. (D) Photographs of M1 solutions (0.04 to 1.00 mM) recorded using a hand-held UV lamp. (E) Cartoon representations showing the various limiting self-assembled form of M1 and the fluorescence color changes expected as the concentration of the monomers is increased. (Scale bars: A, 100 μm; B, 20.0 μm; C, 100 μm.)

