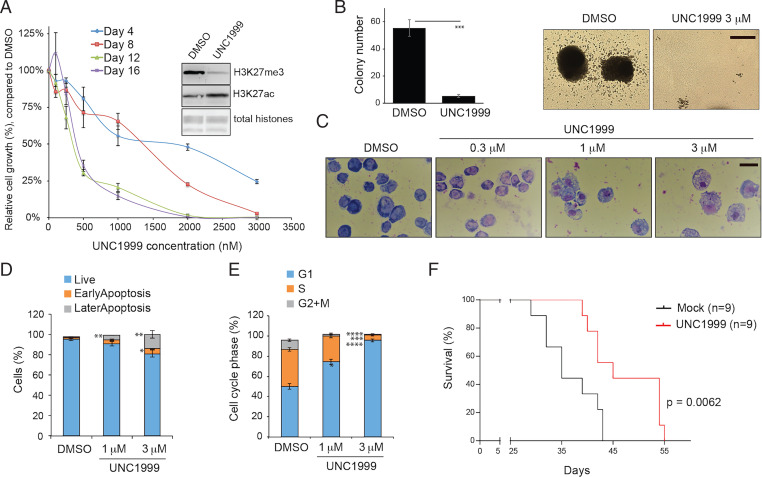
Fig. 1.
PRC2 sustains tumorigenesis in the NUP98-NSD1+ AML. (A) Proliferation of NUP98-NSD1–transformed murine AML cells after treatment with UNC1999, an enzymatic inhibitor of EZH2/1, for the indicated duration. The y-axis represents the relative percentage of cell numbers in cultures, normalized to dimethyl sulfoxide (DMSO) treatment (n = 3 independent experiments; shown as mean ± SD). Inset shows immunoblotting of global H3K27me3 and H3K27ac after a 24-h treatment with 3 μM of UNC1999, relative to DMSO. (B) Quantification of CFUs (Left) and images of representative single-cell colonies (Right) formed by NUP98-NSD1+ AML cells, cultured in the semisolid medium containing DMSO or 3 μM of UNC1999 for 10 d (n = 3 independent experiments; mean ± SD; unpaired two-tailed Student’s t test). ***P < 0.001. (Scale bar, 2 mm.) (C) Wright–Giemsa staining images showing the differentiation status of NUP98-NSD1+ AML cells, treated with DMSO or the indicated concentration of UNC1999 for 4 d. (Black bar, 10 μm.) (D and E) Summary of apoptotic cells, analyzed by propidium iodide (PI), and annexin-V staining (D), and cell cycle progress, analyzed by PI-based DNA staining (E), in the NUP98-NSD1+ AML cells, following a 2-d treatment with DMSO or the indicated concentration of UNC1999 (n = 3 independent experiments; mean ± SD; unpaired two-tailed Student’s t test). *P < 0.05; **P < 0.01; ***P < 0.001; ****P < 0.0001. (F) Kaplan–Meier curve showing kinetics of NUP98-NSD1-induced AML in a transplantation model using syngeneic mice. Starting from day 7 posttransplantation, mice received oral administration of either vehicle (blue) or 100 mg/kg UNC1999 (red) once per day. n, cohort size. Statistical significance was determined by log-rank test.

