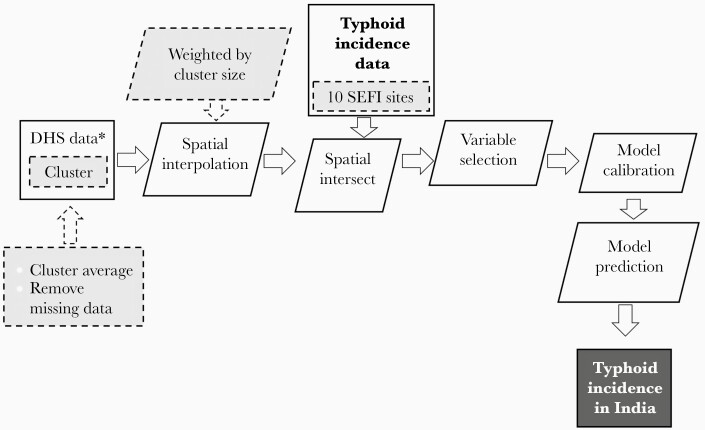
Figure 1.
Summary of the study design for prediction of typhoid incidence in India. The study design followed the outlined process in the figure. We used Demographic and Health Survey (DHS) data on model variables to serve as predictors of typhoid incidence. The DHS variable data were averaged at a cluster level and then interpolated on a 5 × 5-km grid. We geographically intersected the DHS model variable data with the Surveillance for Enteric Fever in India (SEFI) data on observed typhoid incidence. We calibrated a model to estimate the relationship between each DHS model variable and typhoid incidence, and then we utilized a backward selection algorithm for variable selection. When the Akaike Information Criterion was minimized, we used the selected variable(s) as the predictor of typhoid incidence for the model. The rectangles refer to input/output data. The rhomboid shape refers to data processing. The gray shaded color indicates that additional data/processing steps.

